Metro PCS 2009 Annual Report Download - page 118
Download and view the complete annual report
Please find page 118 of the 2009 Metro PCS annual report below. You can navigate through the pages in the report by either clicking on the pages listed below, or by using the keyword search tool below to find specific information within the annual report.-
 1
1 -
2
-
3
-
4
-
5
-
6
-
7
-
8
-
9
-
10
-
11
-
12
-
13
-
14
-
15
-
16
-
17
-
18
-
19
-
20
-
21
-
22
-
23
-
24
-
25
-
26
-
27
-
28
-
29
-
30
-
31
-
32
-
33
-
34
-
35
-
36
-
37
-
38
-
39
-
40
-
41
-
42
-
43
-
44
-
45
-
46
-
47
-
48
-
49
-
50
-
51
-
52
-
53
-
54
-
55
-
56
-
57
-
58
-
59
-
60
-
61
-
62
-
63
-
64
-
65
-
66
-
67
-
68
-
69
-
70
-
71
-
72
-
73
-
74
-
75
-
76
-
77
-
78
-
79
-
80
-
81
-
82
-
83
-
84
-
85
-
86
-
87
-
88
-
89
-
90
-
91
-
92
-
93
-
94
-
95
-
96
-
97
-
98
-
99
-
100
-
101
-
102
-
103
-
104
-
105
-
106
-
107
-
 108
108 -
 109
109 -
 110
110 -
 111
111 -
 112
112 -
 113
113 -
 114
114 -
 115
115 -
 116
116 -
 117
117 -
 118
118 -
 119
119 -
 120
120 -
 121
121 -
 122
122 -
 123
123 -
 124
124 -
 125
125 -
 126
126 -
 127
127 -
 128
128 -
129
-
130
-
131
-
132
-
133
-
134
-
135
-
136
-
137
-
138
-
139
-
140
-
141
-
142
-
143
-
144
-
145
-
146
-
147
-
148
-
149
-
150
-
151
-
152
-
153
-
154
-
155
-
156
-
157
-
158
-
159
-
160
-
161
-
162
-
163
-
164
 |
 |

F-4
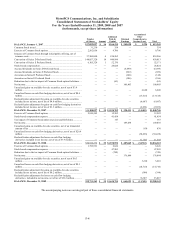
MetroPCS Communications, Inc. and Subsidiaries
Consolidated Statements of Stockholders’ Equity
For the Years Ended December 31, 2009, 2008 and 2007
(in thousands, except share information)
Number
of Shares Amount
Additional
Paid-In
Capital
Retained
Earnings
Accumulated
Other
Comprehensive
Income (Loss) Total
BALANCE, January 1, 2007 .................................................................. 157,052,097 $ 16 $ 166,315 $ 245,690 $ 1,224 $ 413,245
Common Stock issued ............................................................................... 31,230 — 354 — — 354
Exercise of Common Stock options.......................................................... 2,562,056 — 9,706 — — 9,706
Issuance of Common Stock through initial public offering, net of
issuance costs ........................................................................................... 37,500,000 4 818,262 — — 818,266
Conversion of Series D Preferred Stock ................................................... 144,857,320 14 449,999 — — 450,013
Conversion of Series E Preferred Stock.................................................... 6,105,324 1 52,170 — — 52,171
Stock-based compensation ........................................................................ — — 28,024 — — 28,024
Accrued dividends on Series D Preferred Stock....................................... — — — (6,499) — (6,499)
Accrued dividends on Series E Preferred Stock ....................................... — — — (929) — (929)
Accretion on Series D Preferred Stock ..................................................... — — — (148) — (148)
Accretion on Series E Preferred Stock...................................................... — — — (106) — (106)
Reduction due to the tax impact of Common Stock option forfeitures .... — — (61) — — (61)
Net income................................................................................................. — — — 100,403 — 100,403
Unrealized gains on available-for-sale securities, net of tax of $3.9
million ...................................................................................................... — — — — 6,640 6,640
Unrealized losses on cash flow hedging derivatives, net of tax of $8.4
million ...................................................................................................... — — — — (13,614) (13,614)
Reclassification adjustment for gains on available-for-sale securities
included in net income, net of tax of $4.0 million................................... — — — — (6,687) (6,687)
Reclassification adjustment for gains on cash flow hedging derivatives
included in net income, net of tax of $1.3 million................................... — — — — (2,032) (2,032)
BALANCE, December 31, 2007 ............................................................. 348,108,027 $ 35 $1,524,769 $ 338,411 $ (14,469) $1,848,746
Exercise of Common Stock options.......................................................... 2,810,245 — 12,582 — — 12,582
Stock-based compensation expense .......................................................... — — 41,454 — — 41,454
Tax impact of Common Stock option exercises and forfeitures............... — — 167 — — 167
Net income................................................................................................. — — — 149,438 — 149,438
Unrealized gains on available-for-sale securities, net of an immaterial
amount of tax ........................................................................................... — — — — 830 830
Unrealized losses on cash flow hedging derivatives, net of tax of $20.4
million ...................................................................................................... — — — — (30,438) (30,438)
Reclassification adjustment for losses on cash flow hedging
derivatives included in net income, net of tax of $7.9 million................ — — — — 11,544 11,544
BALANCE, December 31, 2008 ............................................................. 350,918,272 $ 35 $1,578,972 $ 487,849 $ (32,533) $2,034,323
Exercise of Common Stock options.......................................................... 1,792,991 — 8,626 — — 8,626
Stock-based compensation expense .......................................................... — — 47,905 — — 47,905
Reduction due to the tax impact of Common Stock option forfeitures .... — — (749) — — (749)
Net income................................................................................................. — — — 176,844 — 176,844
Unrealized gains on available-for-sale securities, net of tax of $0.3
million ...................................................................................................... — — — — 3,210 3,210
Unrealized losses on cash flow hedging derivatives, net of tax of $9.5
million ...................................................................................................... — — — — (14,710) (14,710)
Reclassification adjustment for gains on available-for-sale securities
included in net income, net of tax of $0.2 million................................... — — — — (394) (394)
Reclassification adjustment for losses on cash flow hedging
derivatives included in net income, net of tax of $21.2 million............. — — — — 33,087 33,087
BALANCE, December 31, 2009 ............................................................. 352,711,263 $ 35 $1,634,754 $ 664,693 $ (11,340) $2,288,142
The accompanying notes are an integral part of these consolidated financial statements.