Metro PCS 2009 Annual Report Download - page 150
Download and view the complete annual report
Please find page 150 of the 2009 Metro PCS annual report below. You can navigate through the pages in the report by either clicking on the pages listed below, or by using the keyword search tool below to find specific information within the annual report.-
 1
1 -
2
-
3
-
4
-
5
-
6
-
7
-
8
-
9
-
10
-
11
-
12
-
13
-
14
-
15
-
16
-
17
-
18
-
19
-
20
-
21
-
22
-
23
-
24
-
25
-
26
-
27
-
28
-
29
-
30
-
31
-
32
-
33
-
34
-
35
-
36
-
37
-
38
-
39
-
40
-
41
-
42
-
43
-
44
-
45
-
46
-
47
-
48
-
49
-
50
-
51
-
52
-
53
-
54
-
55
-
56
-
57
-
58
-
59
-
60
-
61
-
62
-
63
-
64
-
65
-
66
-
67
-
68
-
69
-
70
-
71
-
72
-
73
-
74
-
75
-
76
-
77
-
78
-
79
-
80
-
81
-
82
-
83
-
84
-
85
-
86
-
87
-
88
-
89
-
90
-
91
-
92
-
93
-
94
-
95
-
96
-
97
-
98
-
99
-
100
-
101
-
102
-
103
-
104
-
105
-
106
-
107
-
108
-
109
-
110
-
111
-
112
-
113
-
114
-
115
-
116
-
117
-
118
-
119
-
120
-
121
-
122
-
123
-
124
-
125
-
126
-
127
-
128
-
129
-
130
-
131
-
132
-
133
-
134
-
135
-
136
-
137
-
138
-
139
-
 140
140 -
 141
141 -
 142
142 -
 143
143 -
 144
144 -
 145
145 -
 146
146 -
 147
147 -
 148
148 -
 149
149 -
 150
150 -
 151
151 -
 152
152 -
 153
153 -
 154
154 -
 155
155 -
 156
156 -
 157
157 -
 158
158 -
 159
159 -
 160
160 -
161
-
162
-
163
-
164
 |
 |

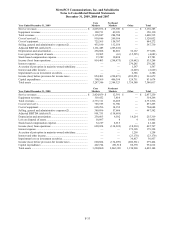
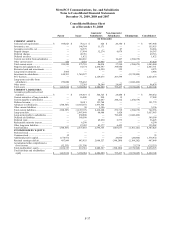
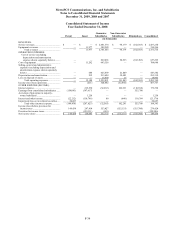
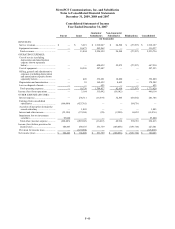
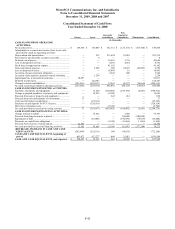
MetroPCS Communications, Inc. and Subsidiaries
Notes to Consolidated Financial Statements
December 31, 2009, 2008 and 2007
F-36
Consolidated Balance Sheet
As of December 31, 2009
Parent Issuer
Guarantor
Subsidiaries
Non-Guarantor
Subsidiaries Eliminations Consolidated
(in thousands)
CURRENT ASSETS:
Cash and cash equivalents ....................... $ 642,089 $ 269,836 $ 682 $ 16,774 $ — $ 929,381
Short-term investments ............................ 224,932 — — — — 224,932
Inventories, net......................................... — 131,599 15,802 — — 147,401
Accounts receivable, net .......................... — 51,438 — 98 — 51,536
Prepaid charges ........................................ — 201 40,547 7,605 — 48,353
Deferred charges ...................................... — 59,414 — — — 59,414
Deferred tax assets ................................... — 1,948 — — — 1,948
Current receivable from subsidiaries....... — 423,275 — 14,574 (437,849) —
Advances to subsidiaries.......................... 610,505 999,234 — 866 (1,610,605) —
Other current assets.................................. 199 7,848 19,913 466 —28,426
Total current assets .................................. 1,477,725 1,944,793 76,944 40,383 (2,048,454) 1,491,391
Property and equipment, net....................... — 34,128 2,722,813 495,272 — 3,252,213
Restricted cash and investments .............. — 15,113 — 325 — 15,438
Long-term investments ............................ 6,319 — — — — 6,319
Investment in subsidiaries........................ 804,847 2,162,686 — — (2,967,533) —
FCC licenses ............................................ — 3,800 2,172,782 293,599 — 2,470,181
Long-term receivable from
subsidiaries ............................................ — 829,360 — — (829,360) —
Other assets .............................................. —92,973 32,885 24,617 —150,475
Total assets............................................... $ 2,288,891 $ 5,082,853 $ 5,005,424 $ 854,196 $ (5,845,347) $ 7,386,017
CURRENT LIABILITIES:
Accounts payable and accrued
expenses................................................. $ — $ 223,973 $ 310,097 $ 24,296 $ — $ 558,366
Current maturities of long-term debt ....... — 16,000 2,451 875 — 19,326
Current payable to subsidiaries................ — — 14,574 423,275 (437,849) —
Deferred revenue...................................... — 38,502 149,152 — — 187,654
Advances from subsidiaries..................... — — 1,610,605 — (1,610,605) —
Other current liabilities ............................ —24,241 7,851 31 —32,123
Total current liabilities............................. — 302,716 2,094,730 448,477 (2,048,454) 797,469
Long-term debt......................................... — 3,448,081 142,096 35,772 — 3,625,949
Long-term payable to subsidiaries........... — — — 829,360 (829,360) —
Deferred tax liabilities ............................. 749 511,557 — — — 512,306
Deferred rents........................................... — — 69,574 10,913 — 80,487
Redeemable ownership interest ............... — 7,857 — — — 7,857
Other long-term liabilities........................ —7,795 57,084 8,928 —73,807
Total liabilities ......................................... 749 4,278,006 2,363,484 1,333,450 (2,877,814) 5,097,875
STOCKHOLDERS’ EQUITY:
Preferred stock ......................................... — —————
Common stock ......................................... 35 ————35
Additional paid-in capital ........................ 1,634,754 — — 20,000 (20,000) 1,634,754
Retained earnings (deficit)....................... 664,693 818,343 2,641,940 (499,254) (2,961,029) 664,693
Accumulated other comprehensive
(loss) income ......................................... (11,340) (13,496) — — 13,496 (11,340)
Total stockholders’ equity ....................... 2,288,142 804,847 2,641,940 (479,254) (2,967,533) 2,288,142
Total liabilities and stockholders’
equity ..................................................... $ 2,288,891 $ 5,082,853 $ 5,005,424 $ 854,196 $ (5,845,347) $ 7,386,017