Metro PCS 2009 Annual Report Download - page 82
Download and view the complete annual report
Please find page 82 of the 2009 Metro PCS annual report below. You can navigate through the pages in the report by either clicking on the pages listed below, or by using the keyword search tool below to find specific information within the annual report.-
 1
1 -
2
-
3
-
4
-
5
-
6
-
7
-
8
-
9
-
10
-
11
-
12
-
13
-
14
-
15
-
16
-
17
-
18
-
19
-
20
-
21
-
22
-
23
-
24
-
25
-
26
-
27
-
28
-
29
-
30
-
31
-
32
-
33
-
34
-
35
-
36
-
37
-
38
-
39
-
40
-
41
-
42
-
43
-
44
-
45
-
46
-
47
-
48
-
49
-
50
-
51
-
52
-
53
-
54
-
55
-
56
-
57
-
58
-
59
-
60
-
61
-
62
-
63
-
64
-
65
-
66
-
67
-
68
-
69
-
70
-
71
-
 72
72 -
 73
73 -
 74
74 -
 75
75 -
 76
76 -
 77
77 -
 78
78 -
 79
79 -
 80
80 -
 81
81 -
 82
82 -
 83
83 -
 84
84 -
 85
85 -
 86
86 -
 87
87 -
 88
88 -
 89
89 -
 90
90 -
 91
91 -
 92
92 -
93
-
94
-
95
-
96
-
97
-
98
-
99
-
100
-
101
-
102
-
103
-
104
-
105
-
106
-
107
-
108
-
109
-
110
-
111
-
112
-
113
-
114
-
115
-
116
-
117
-
118
-
119
-
120
-
121
-
122
-
123
-
124
-
125
-
126
-
127
-
128
-
129
-
130
-
131
-
132
-
133
-
134
-
135
-
136
-
137
-
138
-
139
-
140
-
141
-
142
-
143
-
144
-
145
-
146
-
147
-
148
-
149
-
150
-
151
-
152
-
153
-
154
-
155
-
156
-
157
-
158
-
159
-
160
-
161
-
162
-
163
-
164
 |
 |

70
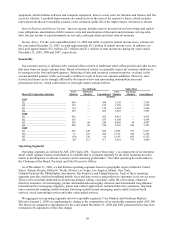
Results of Operations
Year Ended December 31, 2009 Compared to Year Ended December 31, 2008
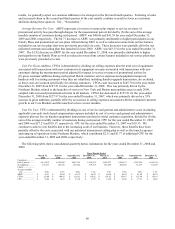
Set forth below is a summary of certain financial information by reportable operating segment for the periods
indicated:
Reportable Operating Segment Data 2009 2008 Change
(in thousands)
REVENUES:
Service revenues:
Core Markets ................................................................................................................ $ 2,895,076 $ 2,424,859 19%
Northeast Markets ........................................................................................................ 235,309 12,391 **
Total ......................................................................................................................... $ 3,130,385 $ 2,437,250 28%
Equipment revenues:
Core Markets ................................................................................................................ $ 300,731 $ 310,452 (3)%
Northeast Markets ........................................................................................................ 49,399 3,814 **
Total ......................................................................................................................... $ 350,130 $ 314,266 11%
OPERATING EXPENSES:
Cost of service (excluding depreciation and amortization disclosed separately below)
(1):
Core Markets ................................................................................................................ $ 910,866 $ 785,595 16%
Northeast Markets ........................................................................................................ 209,186 71,700 192%
Total ......................................................................................................................... $ 1,120,052 $ 857,295 31%
Cost of equipment:
Core Markets ................................................................................................................ $ 725,565 $ 690,296 5%
Northeast Markets ........................................................................................................ 158,707 14,352 **
Total ......................................................................................................................... $ 884,272 $ 704,648 26%
Selling, general and administrative expenses (excluding depreciation and amortization
disclosed separately below) (1):
Core Markets ................................................................................................................ $ 435,180 $ 389,896 12%
Northeast Markets ........................................................................................................ 132,550 57,686 130%
Total ......................................................................................................................... $ 567,730 $ 447,582 27%
Adjusted EBITDA (Deficit) (2):
Core Markets ................................................................................................................ $ 1,161,485 $ 901,751 29%
Northeast Markets ........................................................................................................ $ (205,241) $ (118,618) 73%
Depreciation and amortization:
Core Markets ................................................................................................................ $ 258,888 $ 230,603 12%
Northeast Markets ........................................................................................................ 82,801 6,502 **
Other............................................................................................................................. 36,167 18,214 99%
Total ......................................................................................................................... $ 377,856 $ 255,319 48%
Stock-based compensation expense:
Core Markets ................................................................................................................ $ 37,289 $ 32,227 16%
Northeast Markets ........................................................................................................ 10,494 8,915 18%
Total ......................................................................................................................... $ 47,783 $ 41,142 16%
Income (loss) from operations:
Core Markets ................................................................................................................ $ 854,403 $ 620,024 38%
Northeast Markets ........................................................................................................ (298,473) (134,039) 123%
Other............................................................................................................................. (20,642) (18,218) 13%
Total ......................................................................................................................... $ 535,288 $ 467,767 14%
_____________________________
** Not meaningful.
(1) Cost of service and selling, general and administrative expenses include stock-based compensation expense. For the year ended December
31, 2009, cost of service includes $4.2 million and selling, general and administrative expenses includes approximately $43.6 million of
stock-based compensation expense. For the year ended December 31, 2008, cost of service includes $2.9 million and selling, general and
administrative expenses includes $38.2 million of stock-based compensation expense.
(2) Core and Northeast Markets Adjusted EBITDA (Deficit) is presented in accordance with ASC 280 as it is the primary financial measure
utilized by management to facilitate evaluation of our ability to meet future debt service, capital expenditures and working capital
requirements and to fund future growth.