Kraft 2006 Annual Report Download - page 91
Download and view the complete annual report
Please find page 91 of the 2006 Kraft annual report below. You can navigate through the pages in the report by either clicking on the pages listed below, or by using the keyword search tool below to find specific information within the annual report.-
 1
1 -
2
-
3
-
4
-
5
-
6
-
7
-
8
-
9
-
10
-
11
-
12
-
13
-
14
-
15
-
16
-
17
-
18
-
19
-
20
-
21
-
22
-
23
-
24
-
25
-
26
-
27
-
28
-
29
-
30
-
31
-
32
-
33
-
34
-
35
-
36
-
37
-
38
-
39
-
40
-
41
-
42
-
43
-
44
-
45
-
46
-
47
-
48
-
49
-
50
-
51
-
52
-
53
-
54
-
55
-
56
-
57
-
58
-
59
-
60
-
61
-
62
-
63
-
64
-
65
-
66
-
67
-
68
-
69
-
70
-
71
-
72
-
73
-
74
-
75
-
76
-
77
-
78
-
79
-
80
-
 81
81 -
 82
82 -
 83
83 -
 84
84 -
 85
85 -
 86
86 -
 87
87 -
 88
88 -
 89
89 -
 90
90 -
 91
91 -
 92
92 -
 93
93 -
 94
94 -
 95
95 -
 96
96 -
 97
97 -
 98
98 -
 99
99 -
 100
100 -
 101
101 -
102
-
103
-
104
-
105
-
106
-
107
-
108
-
109
-
110
-
111
-
112
-
113
-
114
-
115
-
116
-
117
-
118
-
119
-
120
-
121
-
122
-
123
-
124
-
125
-
126
-
127
-
128
-
129
-
130
-
131
-
132
-
133
-
134
-
135
-
136
-
137
-
138
-
139
-
140
 |
 |

accumulated benefit obligation for the non-U.S. pension plans was $3,784 million and $3,494 million at December 31, 2006 and 2005, respectively.
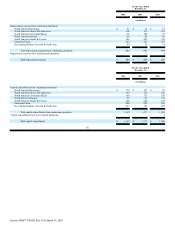
For U.S. plans with accumulated benefit obligations in excess of plan assets, the projected benefit obligations, accumulated benefit obligations and the fair
value of plan assets were $247 million, $196 million and $11 million, respectively, as of December 31, 2006 and $268 million, $211 million and $14 million,
respectively, as of December 31, 2005. The majority of these relate to plans for salaried employees that cannot be funded under IRS regulations. For certain
non-U.S. plans, which have accumulated benefit obligations in excess of plan assets, the projected benefit obligation, accumulated benefit obligation and fair
value of plan assets were $1,364 million, $1,281 million and $646 million, respectively, as of December 31, 2006, and $2,134 million, $1,993 million and
$1,088 million, respectively, as of December 31, 2005.
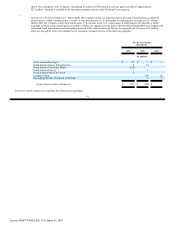
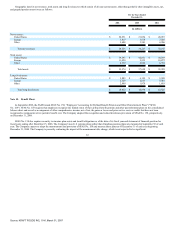
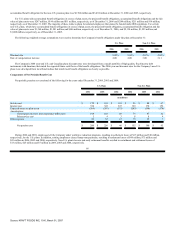
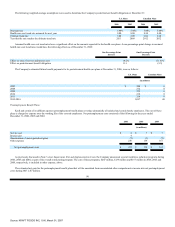
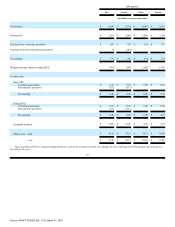
The following weighted-average assumptions were used to determine the Company's benefit obligations under the plans at December 31:
U.S. Plans
Non-U.S. Plans
2006
2005
2006
2005
Discount rate 5.90% 5.60% 4.67% 4.44%
Rate of compensation increase 4.00 4.00 3.00 3.11
The Company's 2006 year-end U.S. and Canadian plans discount rates were developed from a model portfolio of high quality, fixed-income debt
instruments with durations that match the expected future cash flows of the benefit obligations. The 2006 year-end discount rates for the Company's non-U.S.
plans were developed from local bond indices that match local benefit obligations as closely as possible.
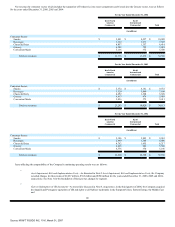
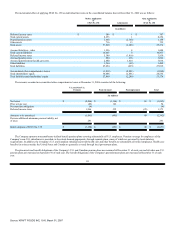
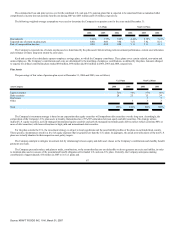
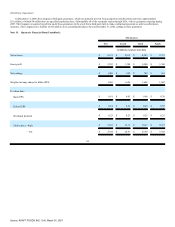
Components of Net Periodic Benefit Cost
Net periodic pension cost consisted of the following for the years ended December 31, 2006, 2005 and 2004:
U.S. Plans
Non-U.S. Plans
2006
2005
2004
2006
2005
2004
(in millions)
Service cost $ 170 $ 165 $ 141 $ 95 $ 80 $ 67
Interest cost 354 345 347 169 170 156
Expected return on plan assets (504) (507) (575) (203) (190) (178)
Amortization:
Unrecognized net loss from experience differences 198 166 89 73 47 32
Prior service cost 5 4 3 8 8 9
Other expense 66 83 41 13 25 7
Net pension cost $ 289 $ 256 $ 46 $ 155 $ 140 $ 93
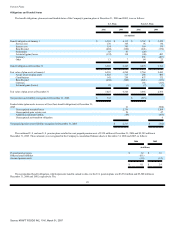
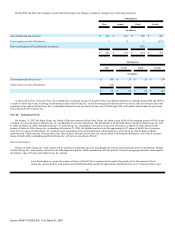
During 2006 and 2005, employees left the Company under workforce reduction programs, resulting in settlement losses of $17 million and $10 million,
respectively, for the U.S. plans. In addition, retiring employees elected lump-sum payments, resulting in settlement losses of $49 million, $73 million and
$41 million in 2006, 2005 and 2004, respectively. Non-U.S. plant closures and early retirement benefits resulted in curtailment and settlement losses of
$13 million, $25 million and $7 million in 2006, 2005 and 2004, respectively.
86
Source: KRAFT FOODS INC, 10-K, March 01, 2007