Kraft 2006 Annual Report Download - page 87
Download and view the complete annual report
Please find page 87 of the 2006 Kraft annual report below. You can navigate through the pages in the report by either clicking on the pages listed below, or by using the keyword search tool below to find specific information within the annual report.-
 1
1 -
2
-
3
-
4
-
5
-
6
-
7
-
8
-
9
-
10
-
11
-
12
-
13
-
14
-
15
-
16
-
17
-
18
-
19
-
20
-
21
-
22
-
23
-
24
-
25
-
26
-
27
-
28
-
29
-
30
-
31
-
32
-
33
-
34
-
35
-
36
-
37
-
38
-
39
-
40
-
41
-
42
-
43
-
44
-
45
-
46
-
47
-
48
-
49
-
50
-
51
-
52
-
53
-
54
-
55
-
56
-
57
-
58
-
59
-
60
-
61
-
62
-
63
-
64
-
65
-
66
-
67
-
68
-
69
-
70
-
71
-
72
-
73
-
74
-
75
-
76
-
 77
77 -
 78
78 -
 79
79 -
 80
80 -
 81
81 -
 82
82 -
 83
83 -
 84
84 -
 85
85 -
 86
86 -
 87
87 -
 88
88 -
 89
89 -
 90
90 -
 91
91 -
 92
92 -
 93
93 -
 94
94 -
 95
95 -
 96
96 -
 97
97 -
98
-
99
-
100
-
101
-
102
-
103
-
104
-
105
-
106
-
107
-
108
-
109
-
110
-
111
-
112
-
113
-
114
-
115
-
116
-
117
-
118
-
119
-
120
-
121
-
122
-
123
-
124
-
125
-
126
-
127
-
128
-
129
-
130
-
131
-
132
-
133
-
134
-
135
-
136
-
137
-
138
-
139
-
140
 |
 |

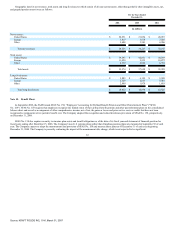
For the Years Ended
December 31,
2006
2005
2004
(in millions)
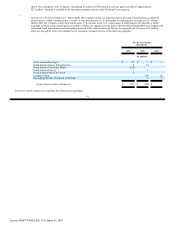
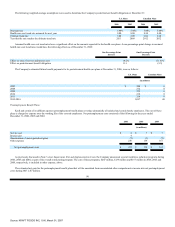
Depreciation expense from continuing operations:
North America Beverages $ 65 $ 65 $ 61
North America Cheese & Foodservice 110 113 118
North America Convenient Meals 112 108 97
North America Grocery 68 60 80
North America Snacks & Cereals 202 205 199
European Union 232 233 235
Developing Markets, Oceania & North Asia 95 83 74
Total depreciation expense from continuing operations 884 867 864
Depreciation expense from discontinued operations 2 4
Total depreciation expense $ 884 $ 869 $ 868
For the Years Ended
December 31,
2006
2005
2004
(in millions)
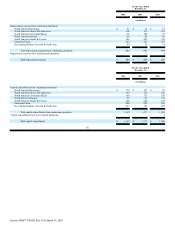
Capital expenditures from continuing operations:
North America Beverages $ 179 $ 147 $ 92
North America Cheese & Foodservice 139 133 132
North America Convenient Meals 169 137 130
North America Grocery 65 81 65
North America Snacks & Cereals 160 222 194
European Union 240 292 280
Developing Markets, Oceania & North Asia 217 159 109
Total capital expenditures from continuing operations 1,169 1,171 1,002
Capital expenditures from discontinued operations 4
Total capital expenditures $ 1,169 $ 1,171 $ 1,006
82
Source: KRAFT FOODS INC, 10-K, March 01, 2007