Kraft 2006 Annual Report Download - page 86
Download and view the complete annual report
Please find page 86 of the 2006 Kraft annual report below. You can navigate through the pages in the report by either clicking on the pages listed below, or by using the keyword search tool below to find specific information within the annual report.-
 1
1 -
2
-
3
-
4
-
5
-
6
-
7
-
8
-
9
-
10
-
11
-
12
-
13
-
14
-
15
-
16
-
17
-
18
-
19
-
20
-
21
-
22
-
23
-
24
-
25
-
26
-
27
-
28
-
29
-
30
-
31
-
32
-
33
-
34
-
35
-
36
-
37
-
38
-
39
-
40
-
41
-
42
-
43
-
44
-
45
-
46
-
47
-
48
-
49
-
50
-
51
-
52
-
53
-
54
-
55
-
56
-
57
-
58
-
59
-
60
-
61
-
62
-
63
-
64
-
65
-
66
-
67
-
68
-
69
-
70
-
71
-
72
-
73
-
74
-
75
-
 76
76 -
 77
77 -
 78
78 -
 79
79 -
 80
80 -
 81
81 -
 82
82 -
 83
83 -
 84
84 -
 85
85 -
 86
86 -
 87
87 -
 88
88 -
 89
89 -
 90
90 -
 91
91 -
 92
92 -
 93
93 -
 94
94 -
 95
95 -
 96
96 -
97
-
98
-
99
-
100
-
101
-
102
-
103
-
104
-
105
-
106
-
107
-
108
-
109
-
110
-
111
-
112
-
113
-
114
-
115
-
116
-
117
-
118
-
119
-
120
-
121
-
122
-
123
-
124
-
125
-
126
-
127
-
128
-
129
-
130
-
131
-
132
-
133
-
134
-
135
-
136
-
137
-
138
-
139
-
140
 |
 |

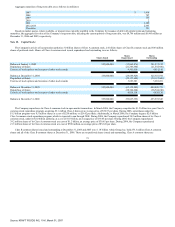
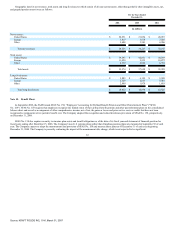
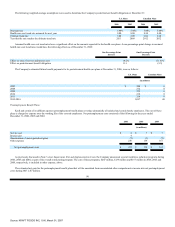
Africa. The redemption of the Company's outstanding investment in UB resulted in a pre-tax gain on closing of approximately
$251 million. This gain is included in the operating companies income of the European Union segment.
•
Gains/Losses on Sales of Businesses—During 2006, the Company sold its rice brand and assets, pet snacks brand and assets, industrial
coconut assets, certain Canadian assets, a small U.S. biscuit brand and a U.S. coffee plant for aggregate pre-tax gains of $117 million.
During 2005, the Company sold its fruit snacks assets, U.K. desserts assets, U.S. yogurt assets, a small business in Colombia, a minor
trademark in Mexico and a small equity investment in Turkey for aggregate pre-tax gains of $108 million. During 2004, the Company sold
a Brazilian snack nuts business and trademarks associated with a candy business in Norway for aggregate pre-tax losses of $3 million.
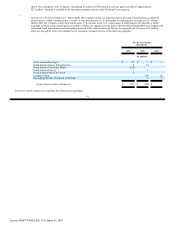
These pre-tax (gains) losses were included in the operating companies income of the following segments:
For the Years Ended
December 31,
2006
2005
2004
(in millions)
North America Beverages $ 95 $ — $ —
North America Cheese & Foodservice 8 (1)
North America Convenient Meals (226)
North America Grocery 1 2
North America Snacks & Cereals 5
European Union (114) (5)
Developing Markets, Oceania & North Asia 5 8
(Gains) losses on sales of businesses $ (117) $ (108) $ 3
See Notes 5 and 6, respectively, regarding divestitures and acquisitions.
81
Source: KRAFT FOODS INC, 10-K, March 01, 2007