Kraft 2006 Annual Report Download - page 43
Download and view the complete annual report
Please find page 43 of the 2006 Kraft annual report below. You can navigate through the pages in the report by either clicking on the pages listed below, or by using the keyword search tool below to find specific information within the annual report.-
 1
1 -
2
-
3
-
4
-
5
-
6
-
7
-
8
-
9
-
10
-
11
-
12
-
13
-
14
-
15
-
16
-
17
-
18
-
19
-
20
-
21
-
22
-
23
-
24
-
25
-
26
-
27
-
28
-
29
-
30
-
31
-
32
-
 33
33 -
 34
34 -
 35
35 -
 36
36 -
 37
37 -
 38
38 -
 39
39 -
 40
40 -
 41
41 -
 42
42 -
 43
43 -
 44
44 -
 45
45 -
 46
46 -
 47
47 -
 48
48 -
 49
49 -
 50
50 -
 51
51 -
 52
52 -
 53
53 -
54
-
55
-
56
-
57
-
58
-
59
-
60
-
61
-
62
-
63
-
64
-
65
-
66
-
67
-
68
-
69
-
70
-
71
-
72
-
73
-
74
-
75
-
76
-
77
-
78
-
79
-
80
-
81
-
82
-
83
-
84
-
85
-
86
-
87
-
88
-
89
-
90
-
91
-
92
-
93
-
94
-
95
-
96
-
97
-
98
-
99
-
100
-
101
-
102
-
103
-
104
-
105
-
106
-
107
-
108
-
109
-
110
-
111
-
112
-
113
-
114
-
115
-
116
-
117
-
118
-
119
-
120
-
121
-
122
-
123
-
124
-
125
-
126
-
127
-
128
-
129
-
130
-
131
-
132
-
133
-
134
-
135
-
136
-
137
-
138
-
139
-
140
 |
 |

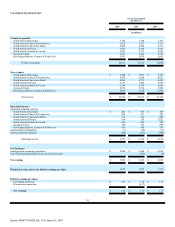
of additional tax expense that arose from the sale of the sugar confectionery business in the second quarter of 2005.
Net earnings of $2,632 million decreased $33 million (1.2%). Diluted EPS from net earnings, which was $1.55, was equal to 2004.
Operating Results by Reportable Segment
2006 compared with 2005
The following discussion compares operating results within each of Kraft's reportable segments for 2006 with 2005.
North America Beverages. Volume decreased 6.8%, including the 53 rd week of shipments in 2005 (representing approximately 2 percentage points of
decline), due primarily to a decline in refreshment beverages volume resulting from the discontinuation of certain ready-to-drink product lines and lower
shipments of coffee.
Net revenues increased $32 million (1.0%), due primarily to higher pricing, net of increased promotional spending ($36 million) and favorable currency
($14 million), partially offset by lower volume/mix ($17 million, including the 53rd week in 2005). Coffee net revenues increased due to higher commodity-based
pricing, partially offset by lower shipments. In powdered beverages, favorable mix from new products also drove higher net revenues. Ready-to-drink net
revenues declined due to lower shipments and discontinuation of certain products.
Operating companies income decreased $258 million (55.7%), due primarily to the loss on the sale of a U.S. coffee plant ($95 million), higher pre-tax
charges for asset impairment and exit costs ($85 million, including $75 million as part of theTassimo asset impairment) and unfavorable costs, net of higher
pricing ($69 million, including higher commodity costs).
North America Cheese & Foodservice. Volume decreased 4.8%, including the 53 rd week of shipments in 2005 (representing approximately 2 percentage
points of decline), due primarily to the divestitures of Canadian grocery assets, U.S. yogurt assets and industrial coconut assets, and lower volume in foodservice.
In foodservice, volume declined due to the discontinuation of lower margin product lines. Cheese volume was flat as higher shipments of natural and cream
cheese were offset by the impact of divestitures and the 53rd week of shipments in 2005.
Net revenues decreased $166 million (2.7%), due primarily to lower net pricing ($114 million, representing increased promotional spending, net of higher
pricing), lower volume/mix ($60 million, including the 53rd week in 2005) and the impact of divestitures ($53 million), partially offset by favorable currency
($61 million). In foodservice, net revenues decreased due primarily to lower volume, the impact of divestitures and lower cheese pricing, partially offset by
favorable currency. Cheese net revenues decreased due primarily to lower net pricing in response to declining cheese costs and the impact of divestitures,
partially offset by favorable currency.
Operating companies income decreased $35 million (3.8%), due primarily to higher pre-tax charges for asset impairment and exit costs ($72 million), lower
volume/mix ($22 million, including the 53rd week in 2005), higher marketing spending ($20 million), higher implementation costs ($11 million) and the 2006
loss on sale of industrial coconut assets ($8 million), partially offset by favorable costs (primarily cheese commodity costs), net of lower net pricing
($79 million), lower fixed manufacturing costs ($11 million) and favorable currency ($9 million).
North America Convenient Meals. Volume increased 0.5%, despite the 53 rd week of shipments in 2005 (representing approximately 2 percentage points
of decline), driven by higher meat shipments (cold cuts, hot dogs and bacon) and higher shipments of pizza, partially offset by lower shipments of dinners, due to
competition in macaroni and cheese dinners, and the divestiture of the rice brand and assets.
39
Source: KRAFT FOODS INC, 10-K, March 01, 2007