Kraft 2006 Annual Report Download - page 8
Download and view the complete annual report
Please find page 8 of the 2006 Kraft annual report below. You can navigate through the pages in the report by either clicking on the pages listed below, or by using the keyword search tool below to find specific information within the annual report.-
 1
1 -
 2
2 -
 3
3 -
 4
4 -
 5
5 -
 6
6 -
 7
7 -
 8
8 -
 9
9 -
 10
10 -
 11
11 -
 12
12 -
 13
13 -
 14
14 -
 15
15 -
 16
16 -
 17
17 -
 18
18 -
 19
19 -
20
-
21
-
22
-
23
-
24
-
25
-
26
-
27
-
28
-
29
-
30
-
31
-
32
-
33
-
34
-
35
-
36
-
37
-
38
-
39
-
40
-
41
-
42
-
43
-
44
-
45
-
46
-
47
-
48
-
49
-
50
-
51
-
52
-
53
-
54
-
55
-
56
-
57
-
58
-
59
-
60
-
61
-
62
-
63
-
64
-
65
-
66
-
67
-
68
-
69
-
70
-
71
-
72
-
73
-
74
-
75
-
76
-
77
-
78
-
79
-
80
-
81
-
82
-
83
-
84
-
85
-
86
-
87
-
88
-
89
-
90
-
91
-
92
-
93
-
94
-
95
-
96
-
97
-
98
-
99
-
100
-
101
-
102
-
103
-
104
-
105
-
106
-
107
-
108
-
109
-
110
-
111
-
112
-
113
-
114
-
115
-
116
-
117
-
118
-
119
-
120
-
121
-
122
-
123
-
124
-
125
-
126
-
127
-
128
-
129
-
130
-
131
-
132
-
133
-
134
-
135
-
136
-
137
-
138
-
139
-
140
 |
 |

(c)
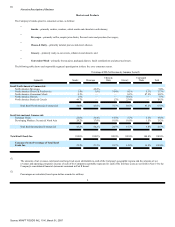
Narrative Description of Business
Markets and Products
The Company's brands span five consumer sectors, as follows:
•
Snacks—primarily cookies, crackers, salted snacks and chocolate confectionery;
•
Beverages—primarily coffee, aseptic juice drinks, flavored water and powdered beverages;
•
Cheese & Dairy—primarily natural, process and cream cheeses;
•
Grocery—primarily ready-to-eat cereals, enhancers and desserts; and
•
Convenient Meals—primarily frozen pizza, packaged dinners, lunch combinations and processed meats.
The following table shows each reportable segment's participation in these five core consumer sectors.
Percentage of 2006 Net Revenues by Consumer Sector(2)
Segment(1)
Snacks
Beverages
Cheese &
Dairy
Grocery
Convenient
Meals
Total
Kraft North America Commercial:
North America Beverages — 42.2% — — — 9.0%
North America Cheese & Foodservice 3.4% 3.6% 74.4% 8.1% 5.3% 17.7%
North America Convenient Meals 0.1% — — 0.2% 87.9% 14.2%
North America Grocery 1.6% — — 50.6% — 7.9%
North America Snacks & Cereals 49.7% — 1.3% 25.4% — 18.5%
Total Kraft North America Commercial 54.8% 45.8% 75.7% 84.3% 93.2% 67.3%
Kraft International Commercial:
European Union 25.0% 36.4% 14.3% 5.7% 5.3% 19.4%
Developing Markets, Oceania & North Asia 20.2% 17.8% 10.0% 10.0% 1.5% 13.3%
Total Kraft International Commercial 45.2% 54.2% 24.3% 15.7% 6.8% 32.7%
Total Kraft Foods Inc. 100.0% 100.0% 100.0% 100.0% 100.0% 100.0%
Consumer Sector Percentage of Total Kraft
Foods Inc. 29.2% 21.3% 18.7% 14.8% 16.0% 100.0%
(1)
The amounts of net revenues, total assets and long-lived assets attributable to each of the Company's geographic regions and the amounts of net
revenues and operating companies income of each of the Company's reportable segments for each of the last three years are set forth in Note 14 to the
Company's consolidated financial statements contained in Part II hereof.
(2)
Percentages are calculated based upon dollars rounded to millions.
4
Source: KRAFT FOODS INC, 10-K, March 01, 2007