Kraft 2006 Annual Report Download - page 40
Download and view the complete annual report
Please find page 40 of the 2006 Kraft annual report below. You can navigate through the pages in the report by either clicking on the pages listed below, or by using the keyword search tool below to find specific information within the annual report.-
 1
1 -
2
-
3
-
4
-
5
-
6
-
7
-
8
-
9
-
10
-
11
-
12
-
13
-
14
-
15
-
16
-
17
-
18
-
19
-
20
-
21
-
22
-
23
-
24
-
25
-
26
-
27
-
28
-
29
-
 30
30 -
 31
31 -
 32
32 -
 33
33 -
 34
34 -
 35
35 -
 36
36 -
 37
37 -
 38
38 -
 39
39 -
 40
40 -
 41
41 -
 42
42 -
 43
43 -
 44
44 -
 45
45 -
 46
46 -
 47
47 -
 48
48 -
 49
49 -
 50
50 -
51
-
52
-
53
-
54
-
55
-
56
-
57
-
58
-
59
-
60
-
61
-
62
-
63
-
64
-
65
-
66
-
67
-
68
-
69
-
70
-
71
-
72
-
73
-
74
-
75
-
76
-
77
-
78
-
79
-
80
-
81
-
82
-
83
-
84
-
85
-
86
-
87
-
88
-
89
-
90
-
91
-
92
-
93
-
94
-
95
-
96
-
97
-
98
-
99
-
100
-
101
-
102
-
103
-
104
-
105
-
106
-
107
-
108
-
109
-
110
-
111
-
112
-
113
-
114
-
115
-
116
-
117
-
118
-
119
-
120
-
121
-
122
-
123
-
124
-
125
-
126
-
127
-
128
-
129
-
130
-
131
-
132
-
133
-
134
-
135
-
136
-
137
-
138
-
139
-
140
 |
 |
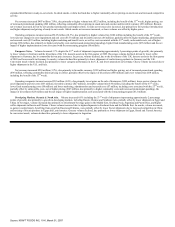
For the Year Ended December 31, 2004
Restructuring
Costs
Asset
Impairment
Total Asset
Impairment
and
Exit Costs
Equity Impairment
and
Implementation
Costs
Total
(in millions)
North America Beverages $ 36 $ — $ 36 $ 5 $ 41
North America Cheese & Foodservice 68 8 76 6 82
North America Convenient Meals 41 41 4 45
North America Grocery 16 16 7 23
North America Snacks & Cereals 222 222 18 240
European Union 180 180 8 188
Developing Markets, Oceania & North Asia 20 12 32 49 81
Total—Continuing Operations $ 583 $ 20 $ 603 $ 97 $ 700
•
Gain on Redemption of United Biscuits Investment—As more fully discussed in Note 6.Acquisitions, in the third quarter of 2006, the
Company acquired the Spanish and Portuguese operations of United Biscuits ("UB") and rights to all Nabisco trademarks in the European
Union, Eastern Europe, the Middle East and Africa. The redemption of the Company's outstanding investment in UB resulted in a pre-tax
gain on closing of $251 million. This gain is included in the operating companies income of the European Union segment.
•
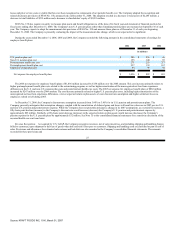
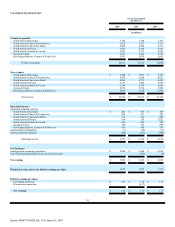
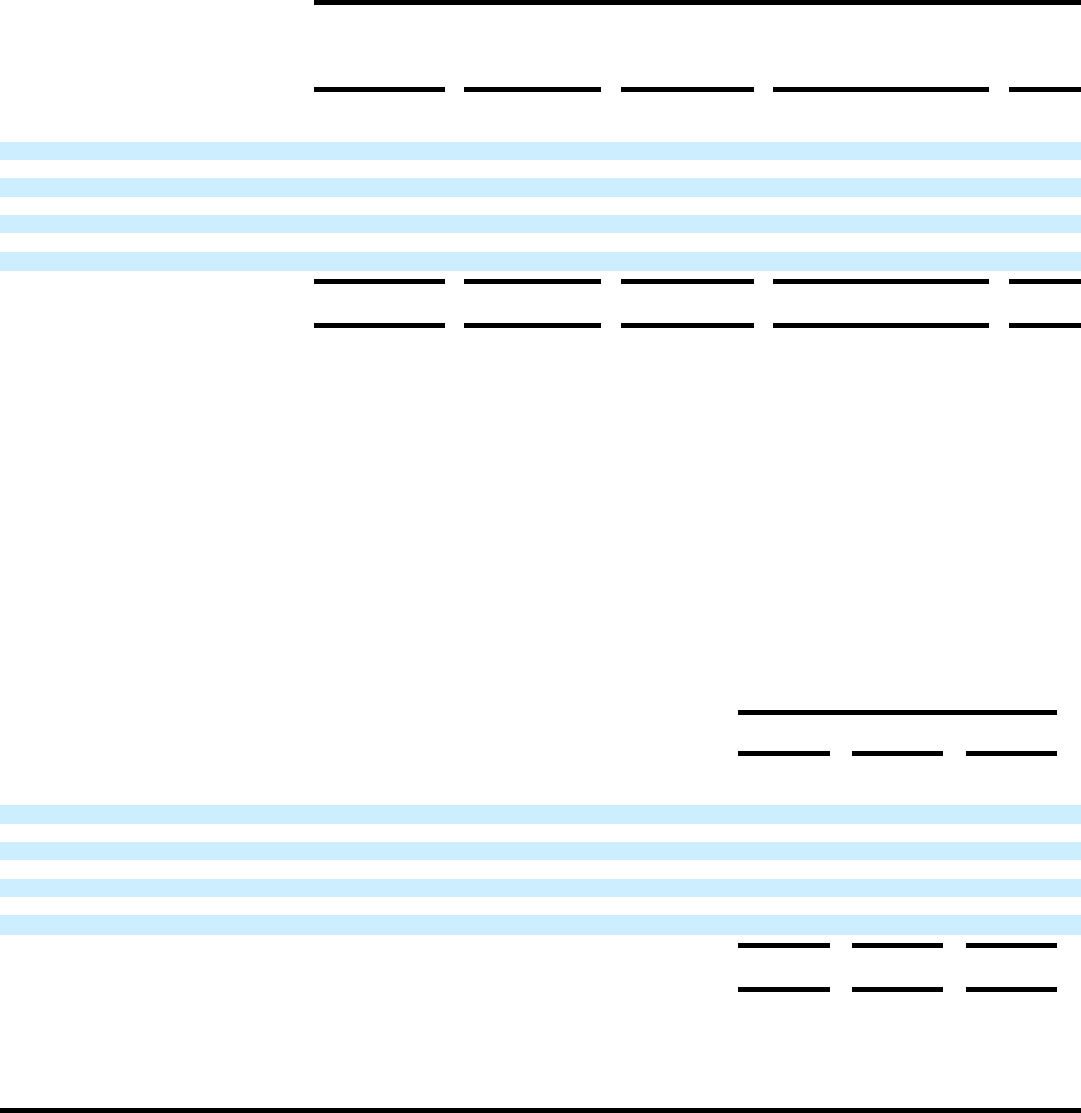
Gains/Losses on Sales of Businesses—During 2006, the Company sold its rice brand and assets, pet snacks brand and assets, industrial
coconut assets, certain Canadian assets, a small U.S. biscuit brand and a U.S. coffee plant for aggregate pre-tax gains of $117 million.
During 2005, the Company sold its fruit snacks assets, U.K. desserts assets, U.S. yogurt assets, a small business in Colombia, a minor
trademark in Mexico and a small equity investment in Turkey for aggregate pre-tax gains of $108 million. During 2004, the Company sold
a Brazilian snack nuts business and trademarks associated with a candy business in Norway for aggregate pre-tax losses of $3 million.
These pre-tax (gains) losses were included in the operating companies income of the following segments:
For the Years Ended
December 31,
2006
2005
2004
(in millions)
North America Beverages $ 95 $ — $ —
North America Cheese & Foodservice 8 (1)
North America Convenient Meals (226)
North America Grocery 1 2
North America Snacks & Cereals 5
European Union (114) (5)
Developing Markets, Oceania & North Asia 5 8
(Gains) losses on sales of businesses $ (117) $ (108) $ 3
As discussed in Note 14 to the consolidated financial statements, the Company's management uses operating companies income, which is defined as
operating income before general corporate expenses and amortization of intangibles, to evaluate segment performance and allocate resources. Management
believes it is appropriate to disclose this measure to help investors analyze the business performance and trends of the various business segments.
36
Source: KRAFT FOODS INC, 10-K, March 01, 2007