Kraft 2006 Annual Report Download - page 85
Download and view the complete annual report
Please find page 85 of the 2006 Kraft annual report below. You can navigate through the pages in the report by either clicking on the pages listed below, or by using the keyword search tool below to find specific information within the annual report.-
 1
1 -
2
-
3
-
4
-
5
-
6
-
7
-
8
-
9
-
10
-
11
-
12
-
13
-
14
-
15
-
16
-
17
-
18
-
19
-
20
-
21
-
22
-
23
-
24
-
25
-
26
-
27
-
28
-
29
-
30
-
31
-
32
-
33
-
34
-
35
-
36
-
37
-
38
-
39
-
40
-
41
-
42
-
43
-
44
-
45
-
46
-
47
-
48
-
49
-
50
-
51
-
52
-
53
-
54
-
55
-
56
-
57
-
58
-
59
-
60
-
61
-
62
-
63
-
64
-
65
-
66
-
67
-
68
-
69
-
70
-
71
-
72
-
73
-
74
-
 75
75 -
 76
76 -
 77
77 -
 78
78 -
 79
79 -
 80
80 -
 81
81 -
 82
82 -
 83
83 -
 84
84 -
 85
85 -
 86
86 -
 87
87 -
 88
88 -
 89
89 -
 90
90 -
 91
91 -
 92
92 -
 93
93 -
 94
94 -
 95
95 -
96
-
97
-
98
-
99
-
100
-
101
-
102
-
103
-
104
-
105
-
106
-
107
-
108
-
109
-
110
-
111
-
112
-
113
-
114
-
115
-
116
-
117
-
118
-
119
-
120
-
121
-
122
-
123
-
124
-
125
-
126
-
127
-
128
-
129
-
130
-
131
-
132
-
133
-
134
-
135
-
136
-
137
-
138
-
139
-
140
 |
 |

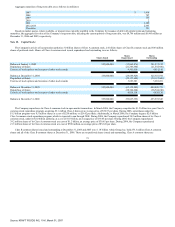
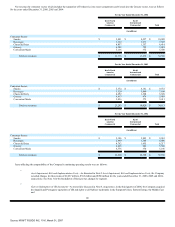
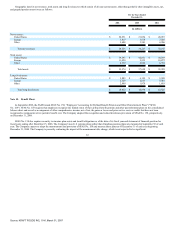
Net revenues by consumer sector, which includes the separation of Foodservice into sector components and Cereals into the Grocery sector, were as follows
for the years ended December 31, 2006, 2005 and 2004:
For the Year Ended December 31, 2006
Kraft North
America
Commercial
Kraft
International
Commercial
Total
(in millions)
Consumer Sector:
Snacks $ 5,491 $ 4,537 $ 10,028
Beverages 3,352 3,973 7,325
Cheese & Dairy 4,857 1,557 6,414
Grocery 4,282 799 5,081
Convenient Meals 5,136 372 5,508
Total net revenues $ 23,118 $ 11,238 $ 34,356
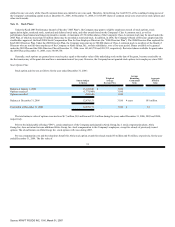
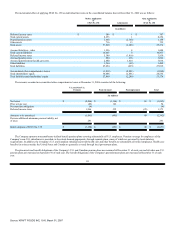
For the Year Ended December 31, 2005
Kraft North
America
Commercial
Kraft
International
Commercial
Total
(in millions)
Consumer Sector:
Snacks $ 5,372 $ 4,161 $ 9,533
Beverages 3,320 3,840 7,160
Cheese & Dairy 4,952 1,568 6,520
Grocery 4,613 876 5,489
Convenient Meals 5,036 375 5,411
Total net revenues $ 23,293 $ 10,820 $ 34,113
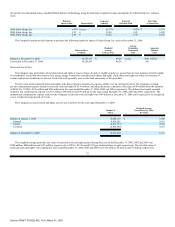
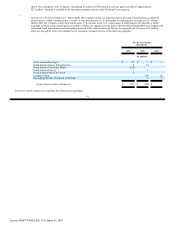
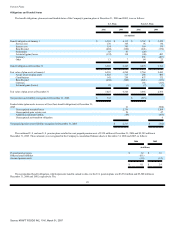
For the Year Ended December 31, 2004
Kraft North
America
Commercial
Kraft
International
Commercial
Total
(in millions)
Consumer Sector:
Snacks $ 5,106 $ 3,895 $ 9,001
Beverages 2,990 3,506 6,496
Cheese & Dairy 4,762 1,455 6,217
Grocery 4,426 882 5,308
Convenient Meals 4,776 370 5,146
Total net revenues $ 22,060 $ 10,108 $ 32,168
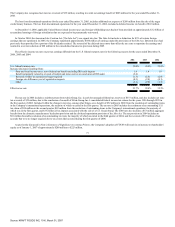
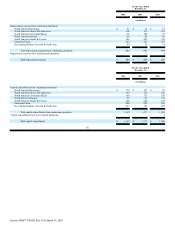
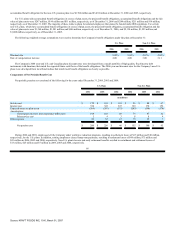
Items affecting the comparability of the Company's continuing operating results were as follows:
•
Asset Impairment, Exit and Implementation Costs—As discussed in Note 3.Asset Impairment, Exit and Implementation Costs, the Company
recorded charges for these items of $1,097 million, $566 million and $700 million for the years ended December 31, 2006, 2005 and 2004,
respectively. See Note 3 for the breakdown of these pre-tax charges by segment.
•
Gain on Redemption of UB Investment—As more fully discussed in Note 6.Acquisitions, in the third quarter of 2006, the Company acquired
the Spanish and Portuguese operations of UB and rights to all Nabisco trademarks in the European Union, Eastern Europe, the Middle East
and
80
Source: KRAFT FOODS INC, 10-K, March 01, 2007