Kraft 2006 Annual Report Download - page 48
Download and view the complete annual report
Please find page 48 of the 2006 Kraft annual report below. You can navigate through the pages in the report by either clicking on the pages listed below, or by using the keyword search tool below to find specific information within the annual report.-
 1
1 -
2
-
3
-
4
-
5
-
6
-
7
-
8
-
9
-
10
-
11
-
12
-
13
-
14
-
15
-
16
-
17
-
18
-
19
-
20
-
21
-
22
-
23
-
24
-
25
-
26
-
27
-
28
-
29
-
30
-
31
-
32
-
33
-
34
-
35
-
36
-
37
-
 38
38 -
 39
39 -
 40
40 -
 41
41 -
 42
42 -
 43
43 -
 44
44 -
 45
45 -
 46
46 -
 47
47 -
 48
48 -
 49
49 -
 50
50 -
 51
51 -
 52
52 -
 53
53 -
 54
54 -
 55
55 -
 56
56 -
 57
57 -
 58
58 -
59
-
60
-
61
-
62
-
63
-
64
-
65
-
66
-
67
-
68
-
69
-
70
-
71
-
72
-
73
-
74
-
75
-
76
-
77
-
78
-
79
-
80
-
81
-
82
-
83
-
84
-
85
-
86
-
87
-
88
-
89
-
90
-
91
-
92
-
93
-
94
-
95
-
96
-
97
-
98
-
99
-
100
-
101
-
102
-
103
-
104
-
105
-
106
-
107
-
108
-
109
-
110
-
111
-
112
-
113
-
114
-
115
-
116
-
117
-
118
-
119
-
120
-
121
-
122
-
123
-
124
-
125
-
126
-
127
-
128
-
129
-
130
-
131
-
132
-
133
-
134
-
135
-
136
-
137
-
138
-
139
-
140
 |
 |

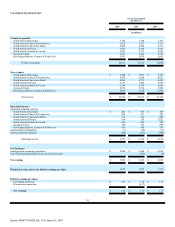
expanded distribution in ready-to-eat cereals. In salted snacks, volume declined due to higher commodity-driven pricing on snack nuts and increased competitive
activity.
Net revenues increased $407 million (7.0%), due primarily to higher volume/mix ($325 million, including the benefit of the 53rd week), higher pricing, net
of increased promotional spending ($42 million, reflecting commodity-driven pricing in snack nuts and cereals) and favorable currency ($36 million). Biscuits
net revenues increased, driven by new product introductions and improved mix. Cereals net revenues also increased, due primarily to new product introductions
and higher shipments and pricing of ready-to-eat cereals. Salted snacks net revenues increased, as lower volume was offset by higher prices.
Operating companies income increased $145 million (18.5%), due primarily to higher volume/mix ($186 million including the benefit of the 53rd week),
lower pre-tax charges for asset impairment and exit costs ($153 million) and favorable currency ($6 million), partially offset by higher marketing, administration
and research costs ($93 million, including higher marketing and benefit costs, as well as costs associated with the 53rd week), unfavorable costs, net of higher
pricing ($74 million, due primarily to higher commodity costs and increased promotional spending), higher fixed manufacturing costs ($23 million) and the net
impact of higher implementation costs associated with the restructuring program ($8 million).
European Union. Volume decreased 3.7% despite the 53 rd week of shipments (representing approximately 2 percentage points of growth), due primarily
to lower volume in Germany and the divestiture of the U.K. desserts assets in the first quarter of 2005. Beverages volume declined, driven by lower coffee
shipments in Germany, due to commodity-driven price increases. In grocery, volume declined, due to the divestiture of the U.K. desserts assets in the first quarter
of 2005 and lower results in Germany. In snacks, volume declined due primarily to lower shipments of confectionery products in Germany and the U.K.
Convenient meals volume declined, due primarily to lower category performance in the U.K. and lower promotions in Germany. Cheese volume increased due to
higher shipments in the U.K. and Italy.
Net revenues increased $210 million (3.2%), due primarily to favorable currency ($198 million) and higher pricing, net of increased promotional spending
($90 million, reflecting commodity-driven pricing in coffee), partially offset by the impact of divestitures ($60 million) and lower volume/mix ($18 million,
including the benefit of the 53rd week).
Operating companies income increased $32 million (4.6%), due primarily to net gains on the sale of businesses ($109 million), lower pre-tax charges for
asset impairment and exit costs ($53 million), favorable currency ($27 million), favorable volume/mix ($10 million, including the benefit of the 53rd week),
lower fixed manufacturing costs ($8 million) and lower marketing, administration and research costs ($7 million, including costs associated with the 53rd week),
partially offset by unfavorable costs, net of higher pricing ($145 million, due primarily to higher commodity costs and increased promotional spending), the
impact of divestitures ($25 million) and the net impact of higher implementation costs associated with the restructuring program ($12 million).
Developing Markets, Oceania & North Asia. Volume increased 0.8% including the 53 rd week of shipments (representing approximately 2 percentage
points of growth), due primarily to growth in developing markets, including Russia, Ukraine and Southeast Asia, partially offset by lower shipments in Egypt and
China. In beverages, volume increased due primarily to refreshment beverage gains in the Middle East, Southeast Asia, Argentina and Puerto Rico, and higher
coffee shipments in Russia and Ukraine. Cheese volume increased due to higher shipments in Southeast Asia and the Middle East. In snacks, volume increased,
as gains in confectionery, benefiting from growth in Russia and Ukraine, were partially offset by lower biscuit shipments due to increased competition in China
and resizing of biscuit products in Egypt and Latin America. Grocery volume declined, due primarily to lower shipments in Egypt, Brazil and Central America.
In convenient meals, volume declined due primarily to lower shipments in Argentina.
44
Source: KRAFT FOODS INC, 10-K, March 01, 2007