Kraft 2006 Annual Report Download - page 42
Download and view the complete annual report
Please find page 42 of the 2006 Kraft annual report below. You can navigate through the pages in the report by either clicking on the pages listed below, or by using the keyword search tool below to find specific information within the annual report.-
 1
1 -
2
-
3
-
4
-
5
-
6
-
7
-
8
-
9
-
10
-
11
-
12
-
13
-
14
-
15
-
16
-
17
-
18
-
19
-
20
-
21
-
22
-
23
-
24
-
25
-
26
-
27
-
28
-
29
-
30
-
31
-
 32
32 -
 33
33 -
 34
34 -
 35
35 -
 36
36 -
 37
37 -
 38
38 -
 39
39 -
 40
40 -
 41
41 -
 42
42 -
 43
43 -
 44
44 -
 45
45 -
 46
46 -
 47
47 -
 48
48 -
 49
49 -
 50
50 -
 51
51 -
 52
52 -
53
-
54
-
55
-
56
-
57
-
58
-
59
-
60
-
61
-
62
-
63
-
64
-
65
-
66
-
67
-
68
-
69
-
70
-
71
-
72
-
73
-
74
-
75
-
76
-
77
-
78
-
79
-
80
-
81
-
82
-
83
-
84
-
85
-
86
-
87
-
88
-
89
-
90
-
91
-
92
-
93
-
94
-
95
-
96
-
97
-
98
-
99
-
100
-
101
-
102
-
103
-
104
-
105
-
106
-
107
-
108
-
109
-
110
-
111
-
112
-
113
-
114
-
115
-
116
-
117
-
118
-
119
-
120
-
121
-
122
-
123
-
124
-
125
-
126
-
127
-
128
-
129
-
130
-
131
-
132
-
133
-
134
-
135
-
136
-
137
-
138
-
139
-
140
 |
 |

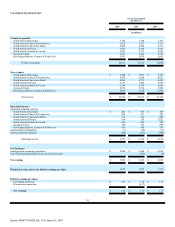
The loss from discontinued operations, net of income taxes, in 2005 was due primarily to the recording of additional tax expense of $297 million that arose
from the sale of the sugar confectionery business in the second quarter of 2005.
Net earnings of $3,060 million increased $428 million (16.3%). Diluted EPS from net earnings, which was $1.85, increased by 19.4%.
2005 compared with 2004
The following discussion compares consolidated operating results for 2005 with 2004.
The Company's 2005 results included 53 weeks of operating results compared with 52 weeks in 2004. The Company estimates that this extra week
positively impacted net revenues and operating income by approximately 2% in 2005 (approximately $625 million and $100 million, respectively).
Volume increased 210 million pounds (1.1%), including the benefit of 53 weeks in 2005 results. Excluding all acquisitions and divestitures, and the 53 rd
week of shipments, volume decreased approximately 1% due primarily to a focus on mix improvement, a SKU reduction program, the impact of higher retail
prices on category growth trends in the United States and declines in certain international countries (most notably Germany), partially offset by new product
introductions and growth in developing markets.
Net revenues increased $1,945 million (6.0%) due primarily to favorable volume/mix ($1,086 million, including the benefit of the 53rd week), favorable
currency ($533 million), higher net pricing ($453 million, reflecting commodity-driven pricing, partially offset by increased promotional spending) and the
impact of acquisitions ($42 million), partially offset by the impact of divested businesses ($174 million).
Operating income increased $140 million (3.0%), due primarily to favorable volume/mix ($479 million, including the benefit of the 53rd week), lower asset
impairment and exit costs ($124 million), net gains on the sales of businesses ($111 million), favorable currency ($90 million) and a 2004 equity investment
impairment charge related to a joint venture in Turkey ($47 million), partially offset by higher marketing, administration and research costs ($420 million,
including higher benefit and marketing costs, as well as costs associated with the 53rd week), higher fixed manufacturing costs ($110 million), unfavorable costs,
net of higher pricing ($102 million, due primarily to higher commodity costs and increased promotional spending), the net impact of higher implementation costs
associated with the restructuring program ($37 million), and the impact of divestitures ($33 million).
Currency movements increased net revenues by $533 million and operating income by $90 million. These increases were due primarily to the weakness of
the U.S. dollar against the euro, the Canadian dollar, the Brazilian real and certain other currencies.
The Company's reported effective income tax rate decreased by 2.9 percentage points to 29.4%, due primarily to the settlement of an outstanding U.S. tax
claim of $24 million; $82 million from the resolution of outstanding items in the Company's international operations; and $33 million in tax impacts associated
with the sale of a U.S. biscuit brand. The 2005 rate also includes a $53 million aggregate benefit from the domestic manufacturers' deduction provision and the
dividend repatriation provision of the American Jobs Creation Act. The tax provision in 2004 included the $81 million favorable resolution of an outstanding tax
item and the reversal of $35 million of tax accruals that were no longer required due to tax events that occurred during 2004.
Earnings from continuing operations of $2,904 million increased $235 million (8.8%), due primarily to higher operating income and a lower income tax
rate. Diluted EPS from continuing operations, which was $1.72, increased by 11.0%.
Loss from discontinued operations, net of income tax, increased $268 million, due primarily to a loss on sale of $297 million in 2005. The loss from
discontinued operations was due primarily to the recording
38
Source: KRAFT FOODS INC, 10-K, March 01, 2007