Kraft 2006 Annual Report Download - page 39
Download and view the complete annual report
Please find page 39 of the 2006 Kraft annual report below. You can navigate through the pages in the report by either clicking on the pages listed below, or by using the keyword search tool below to find specific information within the annual report.-
 1
1 -
2
-
3
-
4
-
5
-
6
-
7
-
8
-
9
-
10
-
11
-
12
-
13
-
14
-
15
-
16
-
17
-
18
-
19
-
20
-
21
-
22
-
23
-
24
-
25
-
26
-
27
-
28
-
 29
29 -
 30
30 -
 31
31 -
 32
32 -
 33
33 -
 34
34 -
 35
35 -
 36
36 -
 37
37 -
 38
38 -
 39
39 -
 40
40 -
 41
41 -
 42
42 -
 43
43 -
 44
44 -
 45
45 -
 46
46 -
 47
47 -
 48
48 -
 49
49 -
50
-
51
-
52
-
53
-
54
-
55
-
56
-
57
-
58
-
59
-
60
-
61
-
62
-
63
-
64
-
65
-
66
-
67
-
68
-
69
-
70
-
71
-
72
-
73
-
74
-
75
-
76
-
77
-
78
-
79
-
80
-
81
-
82
-
83
-
84
-
85
-
86
-
87
-
88
-
89
-
90
-
91
-
92
-
93
-
94
-
95
-
96
-
97
-
98
-
99
-
100
-
101
-
102
-
103
-
104
-
105
-
106
-
107
-
108
-
109
-
110
-
111
-
112
-
113
-
114
-
115
-
116
-
117
-
118
-
119
-
120
-
121
-
122
-
123
-
124
-
125
-
126
-
127
-
128
-
129
-
130
-
131
-
132
-
133
-
134
-
135
-
136
-
137
-
138
-
139
-
140
 |
 |
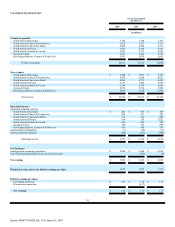
Operating income was affected by the following items during 2006, 2005 and 2004:
•
Asset impairment, exit and implementation costs—As discussed in Note 3 to the consolidated financial statements, during 2006, 2005 and
2004, the Company recorded $1,002 million, $479 million and $603 million, respectively, of asset impairment and exit costs on its
consolidated statement of earnings. Additionally, during 2006, 2005 and 2004, the Company recorded pre-tax implementation costs of
$95 million, $87 million and $50 million, respectively. During 2004, the Company also recorded $47 million of pre-tax impairment charges
related to its equity investment in a joint venture in Turkey.
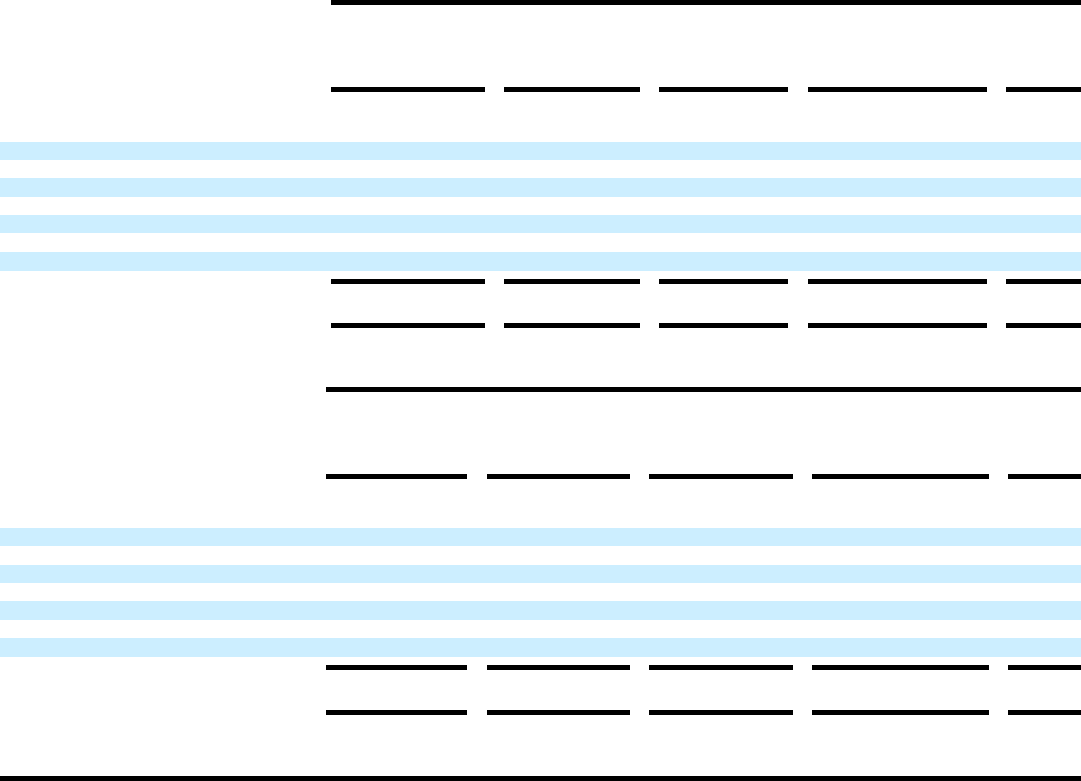
The pre-tax asset impairment, exit and implementation costs for the years ended December 31, 2006, 2005 and 2004, were included in the operating
companies income of the following segments:
For the Year Ended December 31, 2006
Restructuring
Costs
Asset
Impairment
Total Asset
Impairment
and
Exit Costs
Implementation
Costs
Total
(in millions)
North America Beverages $ 21 $ 75 $ 96 $ 12 $ 108
North America Cheese & Foodservice 87 87 15 102
North America Convenient Meals 106 106 12 118
North America Grocery 21 21 9 30
North America Snacks & Cereals 39 168 207 16 223
European Union 230 170 400 23 423
Developing Markets, Oceania & North Asia 74 11 85 8 93
Total—Continuing Operations $ 578 $ 424 $ 1,002 $ 95 $ 1,097
For the Year Ended December 31, 2005
Restructuring
Costs
Asset
Impairment
Total Asset
Impairment
and
Exit Costs
Implementation
Costs
Total
(in millions)
North America Beverages $ 11 $ — $ 11 $ 10 $ 21
North America Cheese & Foodservice 15 15 4 19
North America Convenient Meals 13 13 7 20
North America Grocery 21 206 227 8 235
North America Snacks & Cereals 6 63 69 26 95
European Union 127 127 20 147
Developing Markets, Oceania & North Asia 17 17 12 29
Total—Continuing Operations $ 210 $ 269 $ 479 $ 87 $ 566
35
Source: KRAFT FOODS INC, 10-K, March 01, 2007