Honeywell 2004 Annual Report Download - page 82
Download and view the complete annual report
Please find page 82 of the 2004 Honeywell annual report below. You can navigate through the pages in the report by either clicking on the pages listed below, or by using the keyword search tool below to find specific information within the annual report.-
 1
1 -
2
-
3
-
4
-
5
-
6
-
7
-
8
-
9
-
10
-
11
-
12
-
13
-
14
-
15
-
16
-
17
-
18
-
19
-
20
-
21
-
22
-
23
-
24
-
25
-
26
-
27
-
28
-
29
-
30
-
31
-
32
-
33
-
34
-
35
-
36
-
37
-
38
-
39
-
40
-
41
-
42
-
43
-
44
-
45
-
46
-
47
-
48
-
49
-
50
-
51
-
52
-
53
-
54
-
55
-
56
-
57
-
58
-
59
-
60
-
61
-
62
-
63
-
64
-
65
-
66
-
67
-
68
-
69
-
70
-
71
-
 72
72 -
 73
73 -
 74
74 -
 75
75 -
 76
76 -
 77
77 -
 78
78 -
 79
79 -
 80
80 -
 81
81 -
 82
82 -
 83
83 -
 84
84 -
 85
85 -
 86
86 -
 87
87 -
 88
88 -
 89
89 -
 90
90 -
 91
91 -
 92
92 -
93
-
94
-
95
-
96
-
97
-
98
-
99
-
100
-
101
-
102
-
103
-
104
-
105
-
106
-
107
-
108
-
109
-
110
-
111
-
112
-
113
-
114
-
115
-
116
-
117
-
118
-
119
-
120
-
121
-
122
-
123
-
124
-
125
-
126
-
127
-
128
-
129
-
130
-
131
-
132
-
133
-
134
-
135
-
136
-
137
-
138
-
139
-
140
-
141
-
142
-
143
-
144
-
145
-
146
-
147
-
148
-
149
-
150
-
151
-
152
-
153
-
154
-
155
-
156
-
157
-
158
-
159
-
160
-
161
-
162
-
163
-
164
-
165
-
166
-
167
-
168
-
169
-
170
-
171
-
172
-
173
-
174
-
175
-
176
-
177
-
178
-
179
-
180
-
181
-
182
-
183
-
184
-
185
-
186
-
187
-
188
-
189
-
190
-
191
-
192
-
193
-
194
-
195
-
196
-
197
-
198
-
199
-
200
-
201
-
202
-
203
-
204
-
205
-
206
-
207
-
208
-
209
-
210
-
211
-
212
-
213
-
214
-
215
-
216
-
217
-
218
-
219
-
220
-
221
-
222
-
223
-
224
-
225
-
226
-
227
-
228
-
229
-
230
-
231
-
232
-
233
-
234
-
235
-
236
-
237
-
238
-
239
-
240
-
241
-
242
-
243
-
244
-
245
-
246
-
247
-
248
-
249
-
250
-
251
-
252
-
253
-
254
-
255
-
256
-
257
-
258
-
259
-
260
-
261
-
262
-
263
-
264
-
265
-
266
-
267
-
268
-
269
-
270
-
271
-
272
-
273
-
274
-
275
-
276
-
277
-
278
-
279
-
280
-
281
-
282
-
283
 |
 |

HONEYWELL INTERNATIONAL INC.
NOTES TO FINANCIAL STATEMENTS—(Continued)
(Dollars in millions, except per share amounts)
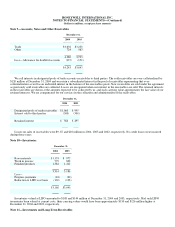
Note 9—Accounts, Notes and Other Receivables
December 31,
2004 2003
Trade $3,656 $3,230
Other 724 563
4,380 3,793
Less—Allowance for doubtful accounts (137) (150)
$4,243 $3,643
We sell interests in designated pools of trade accounts receivables to third parties. The sold receivables are over-collateralized by
$120 million at December 31, 2004 and we retain a subordinated interest in the pool of receivables representing that over-
collateralization as well as an undivided interest in the balance of the receivables pools. New receivables are sold under the agreement
as previously sold receivables are collected. Losses are recognized when our interest in the receivables are sold. The retained interests
in the receivables are shown at the amounts expected to be collected by us, and such carrying value approximates the fair value of our
retained interests. We are compensated for our services in the collection and administration of the receivables.
December 31,
2004 2003
Designated pools of trade receivables $1,060 $ 995
Interest sold to third parties (500) (500)
Retained interest $ 560 $ 495
Losses on sales of receivables were $9, $7 and $10 million in 2004, 2003 and 2002, respectively. No credit losses were incurred
during those years.
Note 10—Inventories
December 31,
2004 2003
Raw materials $1,153 $ 972
Work in process 779 802
Finished products 1,382 1,412
3,314 3,186
Less—
Progress payments (24) (20)
Reduction to LIFO cost basis (130) (126)
$3,160 $3,040
Inventories valued at LIFO amounted to $108 and $144 million at December 31, 2004 and 2003, respectively. Had such LIFO
inventories been valued at current costs, their carrying values would have been approximately $130 and $126 million higher at
December 31, 2004 and 2003, respectively.
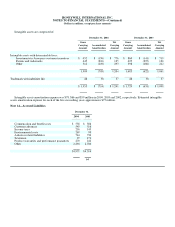
Note 11—Investments and Long-Term Receivables