Honeywell 2004 Annual Report Download - page 110
Download and view the complete annual report
Please find page 110 of the 2004 Honeywell annual report below. You can navigate through the pages in the report by either clicking on the pages listed below, or by using the keyword search tool below to find specific information within the annual report.-
 1
1 -
2
-
3
-
4
-
5
-
6
-
7
-
8
-
9
-
10
-
11
-
12
-
13
-
14
-
15
-
16
-
17
-
18
-
19
-
20
-
21
-
22
-
23
-
24
-
25
-
26
-
27
-
28
-
29
-
30
-
31
-
32
-
33
-
34
-
35
-
36
-
37
-
38
-
39
-
40
-
41
-
42
-
43
-
44
-
45
-
46
-
47
-
48
-
49
-
50
-
51
-
52
-
53
-
54
-
55
-
56
-
57
-
58
-
59
-
60
-
61
-
62
-
63
-
64
-
65
-
66
-
67
-
68
-
69
-
70
-
71
-
72
-
73
-
74
-
75
-
76
-
77
-
78
-
79
-
80
-
81
-
82
-
83
-
84
-
85
-
86
-
87
-
88
-
89
-
90
-
91
-
92
-
93
-
94
-
95
-
96
-
97
-
98
-
99
-
 100
100 -
 101
101 -
 102
102 -
 103
103 -
 104
104 -
 105
105 -
 106
106 -
 107
107 -
 108
108 -
 109
109 -
 110
110 -
 111
111 -
 112
112 -
 113
113 -
 114
114 -
 115
115 -
 116
116 -
 117
117 -
 118
118 -
 119
119 -
 120
120 -
121
-
122
-
123
-
124
-
125
-
126
-
127
-
128
-
129
-
130
-
131
-
132
-
133
-
134
-
135
-
136
-
137
-
138
-
139
-
140
-
141
-
142
-
143
-
144
-
145
-
146
-
147
-
148
-
149
-
150
-
151
-
152
-
153
-
154
-
155
-
156
-
157
-
158
-
159
-
160
-
161
-
162
-
163
-
164
-
165
-
166
-
167
-
168
-
169
-
170
-
171
-
172
-
173
-
174
-
175
-
176
-
177
-
178
-
179
-
180
-
181
-
182
-
183
-
184
-
185
-
186
-
187
-
188
-
189
-
190
-
191
-
192
-
193
-
194
-
195
-
196
-
197
-
198
-
199
-
200
-
201
-
202
-
203
-
204
-
205
-
206
-
207
-
208
-
209
-
210
-
211
-
212
-
213
-
214
-
215
-
216
-
217
-
218
-
219
-
220
-
221
-
222
-
223
-
224
-
225
-
226
-
227
-
228
-
229
-
230
-
231
-
232
-
233
-
234
-
235
-
236
-
237
-
238
-
239
-
240
-
241
-
242
-
243
-
244
-
245
-
246
-
247
-
248
-
249
-
250
-
251
-
252
-
253
-
254
-
255
-
256
-
257
-
258
-
259
-
260
-
261
-
262
-
263
-
264
-
265
-
266
-
267
-
268
-
269
-
270
-
271
-
272
-
273
-
274
-
275
-
276
-
277
-
278
-
279
-
280
-
281
-
282
-
283
 |
 |

HONEYWELL INTERNATIONAL INC.
NOTES TO FINANCIAL STATEMENTS—(Continued)
(Dollars in millions, except per share amounts)
Benefit payments, including amounts to be paid from Company assets, and reflecting expected future service, as appropriate, are
expected to be paid as follows:
2005 $ 912
2006 918
2007 924
2008 933
2009 942
2010-2014 4,938
Other Postretirement Benefits
December 31,
2004 2003
Assumed health care cost trend rate:
Health care cost trend rate assumed for next year 10.0% 11.0%
Rate that the cost trend rate gradually declines to 5.0% 5.0%
Year that the rate reaches the rate it is assumed to remain at 2010 2010
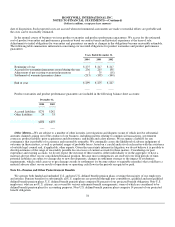
The assumed health care cost trend rate has a significant effect on the amounts reported. A one-percentage-point change in the
assumed health care cost trend rate would have the following effects:
1 percentage point
Increase Decrease
Effect on total of service and interest cost components $ 8 $ (7)
Effect on postretirement benefit obligation $ 123 $ (111)
Benefit payments, including amounts to be paid from Company assets, and reflecting expected future service, as appropriate, are
expected to be paid as follows:
2005 $ 208
2006 198
2007 199
2008 201
2009 197
2010-2014 902
Employee Savings Plans—We sponsor employee savings plans under which we match, in the form of our common stock, certain
eligible U.S. employee savings plan contributions. Shares issued under the stock match plans were 4.3, 6.5 and 5.6 million at a cost of
$151, $173 and $173 million in 2004, 2003 and 2002, respectively.
Note 23—Segment Financial Data
We globally manage our business operations through strategic business units (SBUs) serving customers worldwide with aerospace
products and services, control, sensing and security technologies for buildings, homes and industry, automotive products and
chemicals. Segment information is consistent with how management reviews the businesses, makes investing and resource allocation
decisions and assesses operating performance. Based on similar economic and operational characteristics, our SBUs are aggregated
and managed in four reportable segments as follows:
• Aerospace includes Engines, Systems and Services (auxiliary power units; propulsion engines; environmental control
systems; engine controls; repair and overhaul services; hardware;
84