Honeywell 2004 Annual Report Download - page 50
Download and view the complete annual report
Please find page 50 of the 2004 Honeywell annual report below. You can navigate through the pages in the report by either clicking on the pages listed below, or by using the keyword search tool below to find specific information within the annual report.-
 1
1 -
2
-
3
-
4
-
5
-
6
-
7
-
8
-
9
-
10
-
11
-
12
-
13
-
14
-
15
-
16
-
17
-
18
-
19
-
20
-
21
-
22
-
23
-
24
-
25
-
26
-
27
-
28
-
29
-
30
-
31
-
32
-
33
-
34
-
35
-
36
-
37
-
38
-
39
-
 40
40 -
 41
41 -
 42
42 -
 43
43 -
 44
44 -
 45
45 -
 46
46 -
 47
47 -
 48
48 -
 49
49 -
 50
50 -
 51
51 -
 52
52 -
 53
53 -
 54
54 -
 55
55 -
 56
56 -
 57
57 -
 58
58 -
 59
59 -
 60
60 -
61
-
62
-
63
-
64
-
65
-
66
-
67
-
68
-
69
-
70
-
71
-
72
-
73
-
74
-
75
-
76
-
77
-
78
-
79
-
80
-
81
-
82
-
83
-
84
-
85
-
86
-
87
-
88
-
89
-
90
-
91
-
92
-
93
-
94
-
95
-
96
-
97
-
98
-
99
-
100
-
101
-
102
-
103
-
104
-
105
-
106
-
107
-
108
-
109
-
110
-
111
-
112
-
113
-
114
-
115
-
116
-
117
-
118
-
119
-
120
-
121
-
122
-
123
-
124
-
125
-
126
-
127
-
128
-
129
-
130
-
131
-
132
-
133
-
134
-
135
-
136
-
137
-
138
-
139
-
140
-
141
-
142
-
143
-
144
-
145
-
146
-
147
-
148
-
149
-
150
-
151
-
152
-
153
-
154
-
155
-
156
-
157
-
158
-
159
-
160
-
161
-
162
-
163
-
164
-
165
-
166
-
167
-
168
-
169
-
170
-
171
-
172
-
173
-
174
-
175
-
176
-
177
-
178
-
179
-
180
-
181
-
182
-
183
-
184
-
185
-
186
-
187
-
188
-
189
-
190
-
191
-
192
-
193
-
194
-
195
-
196
-
197
-
198
-
199
-
200
-
201
-
202
-
203
-
204
-
205
-
206
-
207
-
208
-
209
-
210
-
211
-
212
-
213
-
214
-
215
-
216
-
217
-
218
-
219
-
220
-
221
-
222
-
223
-
224
-
225
-
226
-
227
-
228
-
229
-
230
-
231
-
232
-
233
-
234
-
235
-
236
-
237
-
238
-
239
-
240
-
241
-
242
-
243
-
244
-
245
-
246
-
247
-
248
-
249
-
250
-
251
-
252
-
253
-
254
-
255
-
256
-
257
-
258
-
259
-
260
-
261
-
262
-
263
-
264
-
265
-
266
-
267
-
268
-
269
-
270
-
271
-
272
-
273
-
274
-
275
-
276
-
277
-
278
-
279
-
280
-
281
-
282
-
283
 |
 |

$630 million. The increase in cash provided by operating activities was partially offset by an increase in net asbestos related liability
payments of $558 million as the prior year included $472 million in cash received from Equitas related to a comprehensive policy
buy-back settlement, and an increase in working capital (receivables, inventories and accounts payable), usage of $268 million
principally related to higher sales and a weakening of the U.S. dollar versus the Euro and Canadian dollar throughout 2004. Cash
provided by operating activities decreased by $181 million during 2003 compared with 2002 mainly due to a $540 million increase in
voluntary U.S. pension contributions as well as an increase in working capital usage due primarily to a weakening of the U.S. dollar
versus the Euro and Canadian dollar throughout 2003. The decrease was partially offset by reduced severance and exit costs payments
of $247 million, lower litigation payments of $222 million, as well as insurance receipts in excess of asbestos liability payments of
$107 million during 2003.
Cash used for investing activities decreased by $96 million during 2004 compared with 2003 due primarily to an increase in
proceeds from sales of businesses of $289 million largely from the dispositions of our Security Monitoring and VCSEL Optical
Products businesses in the current year. Additionally, proceeds from the maturity of investment securities were $80 million in 2004.
The decrease in cash used for investing activities was partially offset by an increase in spending for acquisitions of $185 million due
principally to various acquisitions in our Automation and Control Solutions reportable segment and an investment of $115 million in
auction rate securities. Cash used for investing activities decreased by $190 million during 2003 compared with 2002 due mainly to
reduced spending of $321 million for acquisitions, principally reflecting the acquisition of Invensys in October 2002. The decrease
was partially offset by reduced proceeds from sales of investments of $91 million related to the disposition of a cost investment in our
Automation and Control Solutions reportable segment in 2002, and reduced proceeds from sales of businesses of $46 million.
Proceeds from business sales in 2003 resulted from the sale of certain non-core Specialty Materials (Engineering Plastics, Rudolstadt
and Metglas) and Aerospace (Honeywell Aerospace Defense Services) businesses.
Cash used for financing activities increased by $328 million during 2004 compared with 2003 due primarily to an increase in
repurchases of common stock of $687 million in connection with our stock repurchase program announced in November 2003
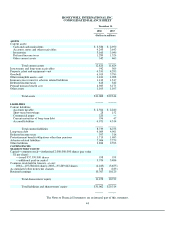
partially offset by a reduction in debt repayments, net of issuances, of $337 million in 2004. Total debt of $5,273 million at December
31, 2004 was $113 million, or 2 percent higher than at December 31, 2003 principally reflecting higher commercial paper borrowings
to fund our share repurchases in 2004. Cash used for financing activities decreased by $37 million during 2003 compared with 2002
mainly due to lower net debt repayments in 2003, partially offset by cash used to repurchase shares in the fourth quarter of 2003. Total
debt of $5,160 million at December 31, 2003 was $71 million, or 1 percent higher than at December 31, 2002 principally reflecting the
assumption of $267 million of debt associated with the purchase of assets under operating leases partially offset by lower short-term
borrowings.
We had approximately $3.4 and $2.6 billion of cash and cash equivalents held by non-U.S. subsidiaries mainly in local currencies
(principally the Euro, Canadian dollar, and Australian dollar) at December 31, 2004 and 2003, respectively. The $190 and $305
million increases in cash and cash equivalents in 2004 and 2003, respectively, due to exchange rate changes, principally resulted from
a weakening of the U.S. dollar mainly against the Euro and Canadian dollar throughout 2004 and 2003. We manage our worldwide
cash requirements considering available cash balances and the most cost effective method to access those cash balances. The
repatriation of cash balances from some non-U.S. subsidiaries to the U.S. could have U.S. tax consequences (see discussion of
American Jobs Creation Act of 2004 in Note 7 of Notes fo Financial Statements in “Item 8. Financial Statements and Supplementary
Data”); however, substantially all cash balances held by non-U.S. subsidiaries are available without legal restrictions to fund business
operations.
Liquidity
We manage our businesses to maximize operating cash flows as the primary source of our liquidity. Operating cash flows were
$2.3 billion in 2004. We have approximately $3.6 billion in cash and cash equivalents and $4.8 billion in working capital (receivables,
inventories and accounts payable).
35