Honeywell 2004 Annual Report Download - page 81
Download and view the complete annual report
Please find page 81 of the 2004 Honeywell annual report below. You can navigate through the pages in the report by either clicking on the pages listed below, or by using the keyword search tool below to find specific information within the annual report.-
 1
1 -
2
-
3
-
4
-
5
-
6
-
7
-
8
-
9
-
10
-
11
-
12
-
13
-
14
-
15
-
16
-
17
-
18
-
19
-
20
-
21
-
22
-
23
-
24
-
25
-
26
-
27
-
28
-
29
-
30
-
31
-
32
-
33
-
34
-
35
-
36
-
37
-
38
-
39
-
40
-
41
-
42
-
43
-
44
-
45
-
46
-
47
-
48
-
49
-
50
-
51
-
52
-
53
-
54
-
55
-
56
-
57
-
58
-
59
-
60
-
61
-
62
-
63
-
64
-
65
-
66
-
67
-
68
-
69
-
70
-
 71
71 -
 72
72 -
 73
73 -
 74
74 -
 75
75 -
 76
76 -
 77
77 -
 78
78 -
 79
79 -
 80
80 -
 81
81 -
 82
82 -
 83
83 -
 84
84 -
 85
85 -
 86
86 -
 87
87 -
 88
88 -
 89
89 -
 90
90 -
 91
91 -
92
-
93
-
94
-
95
-
96
-
97
-
98
-
99
-
100
-
101
-
102
-
103
-
104
-
105
-
106
-
107
-
108
-
109
-
110
-
111
-
112
-
113
-
114
-
115
-
116
-
117
-
118
-
119
-
120
-
121
-
122
-
123
-
124
-
125
-
126
-
127
-
128
-
129
-
130
-
131
-
132
-
133
-
134
-
135
-
136
-
137
-
138
-
139
-
140
-
141
-
142
-
143
-
144
-
145
-
146
-
147
-
148
-
149
-
150
-
151
-
152
-
153
-
154
-
155
-
156
-
157
-
158
-
159
-
160
-
161
-
162
-
163
-
164
-
165
-
166
-
167
-
168
-
169
-
170
-
171
-
172
-
173
-
174
-
175
-
176
-
177
-
178
-
179
-
180
-
181
-
182
-
183
-
184
-
185
-
186
-
187
-
188
-
189
-
190
-
191
-
192
-
193
-
194
-
195
-
196
-
197
-
198
-
199
-
200
-
201
-
202
-
203
-
204
-
205
-
206
-
207
-
208
-
209
-
210
-
211
-
212
-
213
-
214
-
215
-
216
-
217
-
218
-
219
-
220
-
221
-
222
-
223
-
224
-
225
-
226
-
227
-
228
-
229
-
230
-
231
-
232
-
233
-
234
-
235
-
236
-
237
-
238
-
239
-
240
-
241
-
242
-
243
-
244
-
245
-
246
-
247
-
248
-
249
-
250
-
251
-
252
-
253
-
254
-
255
-
256
-
257
-
258
-
259
-
260
-
261
-
262
-
263
-
264
-
265
-
266
-
267
-
268
-
269
-
270
-
271
-
272
-
273
-
274
-
275
-
276
-
277
-
278
-
279
-
280
-
281
-
282
-
283
 |
 |

HONEYWELL INTERNATIONAL INC.
NOTES TO FINANCIAL STATEMENTS—(Continued)
(Dollars in millions, except per share amounts)
income earned outside the U.S. by providing an 85 percent dividends received deduction for certain dividends from controlled foreign
corporations. The deduction is subject to a number of limitations and currently, uncertainty remains as to how to interpret numerous
provisions in the Act. As such, we are not in a position to determine whether, and to what extent, we might repatriate foreign earnings.
Based on our analysis to date, however, it is reasonably possible that we may repatriate some amount up to approximately $2.6 billion.
We estimate the income tax effects of repatriating $2.6 billion to be approximately $150 to $350 million. Honeywell has not provided
for U.S. federal income and foreign withholding taxes on $3.9 billion of undistributed earnings from non-U.S. operations as of
December 31, 2004. Until our analysis of the Act is completed, we will continue to permanently reinvest those earnings. We expect to
finalize our assessment later in 2005.
The extra-territorial income exclusion (ETI) for foreign sales will be phased-out over two years beginning in 2005. The deduction for
income from qualified domestic production activities will be phased-in from 2005 through 2010. Similar to the ETI benefit, the
domestic manufacturing benefit has no effect on deferred tax assets and liabilities existing at the enactment date. Rather, the impact of
this deduction will be reported in the period in which the deduction is claimed on our federal income tax return. We are currently
assessing the details of the Act and the net effect of the phase-out of the ETI and the phase-in of this new deduction. We expect to
complete our analysis later in 2005. Until such time, it is not possible to determine what impact this legislation will have on our
consolidated tax accruals or effective tax rate.
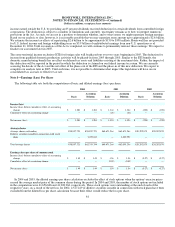
Note 8—Earnings (Loss) Per Share
The following table sets forth the computations of basic and diluted earnings (loss) per share:
2004 2003 2002
Basic Assuming
Dilution Basic Assuming
Dilution Basic Assuming
Dilution
Income (loss)
Income (loss) before cumulative effect of accounting
change $ 1,281 $ 1,281 $ 1,344 $ 1,344 $ (220) $ (220)
Cumulative effect of accounting change — — (20) (20) — —
Net income (loss) $ 1,281 $ 1,281 $ 1,324 $ 1,324 $ (220) $ (220)
Average shares
Average shares outstanding 858,857,721 858,857,721 860,671,264 860,671,264 820,292,870 820,292,870
Dilutive securities issuable in connection with stock
plans — 3,475,613 — 1,423,992 — —
Total average shares 858,857,721 862,333,334 860,671,264 862,095,256 820,292,870 820,292,870
Earnings (loss) per share of common stock
Income (loss) before cumulative effect of accounting
change $ 1.49 $ 1.49 $ 1.56 $ 1.56 $ (0.27) $ (0.27)
Cumulative effect of accounting change — — (0.02) (0.02) — —
Net income (loss) $ 1.49 $ 1.49 $ 1.54 $ 1.54 $ (0.27) $ (0.27)
In 2004 and 2003, the diluted earnings per share calculation excludes the effect of stock options when the options' exercise prices
exceed the average market price of the common shares during the period. In 2004 and 2003, the number of stock options not included
in the computation were 41,656,606 and 41,908,964, respectively. These stock options were outstanding at the end of each of the
respective years. As a result of the net loss for 2002, 2,527,229 of dilutive securities issuable in connection with stock plans have been
excluded from the diluted loss per share calculation because their effect would reduce the loss per share.
61