Honeywell 2004 Annual Report Download - page 30
Download and view the complete annual report
Please find page 30 of the 2004 Honeywell annual report below. You can navigate through the pages in the report by either clicking on the pages listed below, or by using the keyword search tool below to find specific information within the annual report.-
 1
1 -
2
-
3
-
4
-
5
-
6
-
7
-
8
-
9
-
10
-
11
-
12
-
13
-
14
-
15
-
16
-
17
-
18
-
19
-
 20
20 -
 21
21 -
 22
22 -
 23
23 -
 24
24 -
 25
25 -
 26
26 -
 27
27 -
 28
28 -
 29
29 -
 30
30 -
 31
31 -
 32
32 -
 33
33 -
 34
34 -
 35
35 -
 36
36 -
 37
37 -
 38
38 -
 39
39 -
 40
40 -
41
-
42
-
43
-
44
-
45
-
46
-
47
-
48
-
49
-
50
-
51
-
52
-
53
-
54
-
55
-
56
-
57
-
58
-
59
-
60
-
61
-
62
-
63
-
64
-
65
-
66
-
67
-
68
-
69
-
70
-
71
-
72
-
73
-
74
-
75
-
76
-
77
-
78
-
79
-
80
-
81
-
82
-
83
-
84
-
85
-
86
-
87
-
88
-
89
-
90
-
91
-
92
-
93
-
94
-
95
-
96
-
97
-
98
-
99
-
100
-
101
-
102
-
103
-
104
-
105
-
106
-
107
-
108
-
109
-
110
-
111
-
112
-
113
-
114
-
115
-
116
-
117
-
118
-
119
-
120
-
121
-
122
-
123
-
124
-
125
-
126
-
127
-
128
-
129
-
130
-
131
-
132
-
133
-
134
-
135
-
136
-
137
-
138
-
139
-
140
-
141
-
142
-
143
-
144
-
145
-
146
-
147
-
148
-
149
-
150
-
151
-
152
-
153
-
154
-
155
-
156
-
157
-
158
-
159
-
160
-
161
-
162
-
163
-
164
-
165
-
166
-
167
-
168
-
169
-
170
-
171
-
172
-
173
-
174
-
175
-
176
-
177
-
178
-
179
-
180
-
181
-
182
-
183
-
184
-
185
-
186
-
187
-
188
-
189
-
190
-
191
-
192
-
193
-
194
-
195
-
196
-
197
-
198
-
199
-
200
-
201
-
202
-
203
-
204
-
205
-
206
-
207
-
208
-
209
-
210
-
211
-
212
-
213
-
214
-
215
-
216
-
217
-
218
-
219
-
220
-
221
-
222
-
223
-
224
-
225
-
226
-
227
-
228
-
229
-
230
-
231
-
232
-
233
-
234
-
235
-
236
-
237
-
238
-
239
-
240
-
241
-
242
-
243
-
244
-
245
-
246
-
247
-
248
-
249
-
250
-
251
-
252
-
253
-
254
-
255
-
256
-
257
-
258
-
259
-
260
-
261
-
262
-
263
-
264
-
265
-
266
-
267
-
268
-
269
-
270
-
271
-
272
-
273
-
274
-
275
-
276
-
277
-
278
-
279
-
280
-
281
-
282
-
283
 |
 |

industrial plants, offering advanced software and automation systems that integrate, control and monitor complex processes in many
types of industrial settings).
Economic and Other Factors—ACS' operating results are principally driven by global residential and nonresidential construction,
industrial production, capital spending on process and building automation, and fire and security concerns and regulations.
Business Challenges/Areas of Focus—ACS' primary business challenges and areas of focus include:
• Extending technology leadership: lowest total installed cost, integrated solutions within our security, fire and sensors product
portfolios.
• Defending and extending our installed base through customer productivity and globalization.
• Sustaining strong brand recognition.
• Continuing to invest in sales and marketing resources and new product development capabilities to drive profitable growth.
• Integrating Novar plc's Intelligent Building Systems division into our life safety, building controls, security and related
service businesses (acquisition of Novar plc expected to be completed in the first quarter of 2005).
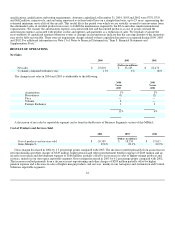
Specialty Materials
2004 2003 2002
(Dollars in millions)
Net sales $ 3,497 $ 3,169 $ 3,205
Segment profit $ 184 $ 136 $ 90
Segment profit % 5.3% 4.3% 2.8%
Specialty Materials develops and manufactures high-purity, high-quality and high-performance chemicals and materials for
applications in the automotive, healthcare, agricultural, packaging, fibers, refrigeration, semiconductor, wax and adhesives markets.
Specialty Materials' product portfolio includes fluorocarbons, specialty films, advanced fibers, customized research chemicals and
intermediates and electronic materials and chemicals. Specialty Materials' core growth businesses are Chemicals, Electronic Materials
and Performance Products.
Economic and Other Factors—Specialty Materials' operating results are principally driven by global gross domestic product,
plant capacity utilization and the costs of raw materials including natural gas and benzene. We expect raw material costs to remain at
historically high levels in 2005 and will continue to attempt to offset raw material cost increases with price increases where feasible.
Business Challenges/Areas of Focus—Specialty Materials' primary business challenges and areas of focus include:
• Sharpening the focus on core growth platforms to drive improved profitability through new product applications and
introductions.
• Continuing to restructure and exit non-core commodity lines of business with minimal or no differentiating technology and/or
exposure to raw material cost volatility.
• Continuing to improve manufacturing productivity.
Transportation Systems
2004 2003 2002
(Dollars in millions)
Net sales $ 4,323 $ 3,650 $ 3,184
Segment profit $ 575 $ 461 $ 393
Segment profit % 13.3% 12.6% 12.3%
17