Honeywell 2004 Annual Report Download - page 43
Download and view the complete annual report
Please find page 43 of the 2004 Honeywell annual report below. You can navigate through the pages in the report by either clicking on the pages listed below, or by using the keyword search tool below to find specific information within the annual report.-
 1
1 -
2
-
3
-
4
-
5
-
6
-
7
-
8
-
9
-
10
-
11
-
12
-
13
-
14
-
15
-
16
-
17
-
18
-
19
-
20
-
21
-
22
-
23
-
24
-
25
-
26
-
27
-
28
-
29
-
30
-
31
-
32
-
 33
33 -
 34
34 -
 35
35 -
 36
36 -
 37
37 -
 38
38 -
 39
39 -
 40
40 -
 41
41 -
 42
42 -
 43
43 -
 44
44 -
 45
45 -
 46
46 -
 47
47 -
 48
48 -
 49
49 -
 50
50 -
 51
51 -
 52
52 -
 53
53 -
54
-
55
-
56
-
57
-
58
-
59
-
60
-
61
-
62
-
63
-
64
-
65
-
66
-
67
-
68
-
69
-
70
-
71
-
72
-
73
-
74
-
75
-
76
-
77
-
78
-
79
-
80
-
81
-
82
-
83
-
84
-
85
-
86
-
87
-
88
-
89
-
90
-
91
-
92
-
93
-
94
-
95
-
96
-
97
-
98
-
99
-
100
-
101
-
102
-
103
-
104
-
105
-
106
-
107
-
108
-
109
-
110
-
111
-
112
-
113
-
114
-
115
-
116
-
117
-
118
-
119
-
120
-
121
-
122
-
123
-
124
-
125
-
126
-
127
-
128
-
129
-
130
-
131
-
132
-
133
-
134
-
135
-
136
-
137
-
138
-
139
-
140
-
141
-
142
-
143
-
144
-
145
-
146
-
147
-
148
-
149
-
150
-
151
-
152
-
153
-
154
-
155
-
156
-
157
-
158
-
159
-
160
-
161
-
162
-
163
-
164
-
165
-
166
-
167
-
168
-
169
-
170
-
171
-
172
-
173
-
174
-
175
-
176
-
177
-
178
-
179
-
180
-
181
-
182
-
183
-
184
-
185
-
186
-
187
-
188
-
189
-
190
-
191
-
192
-
193
-
194
-
195
-
196
-
197
-
198
-
199
-
200
-
201
-
202
-
203
-
204
-
205
-
206
-
207
-
208
-
209
-
210
-
211
-
212
-
213
-
214
-
215
-
216
-
217
-
218
-
219
-
220
-
221
-
222
-
223
-
224
-
225
-
226
-
227
-
228
-
229
-
230
-
231
-
232
-
233
-
234
-
235
-
236
-
237
-
238
-
239
-
240
-
241
-
242
-
243
-
244
-
245
-
246
-
247
-
248
-
249
-
250
-
251
-
252
-
253
-
254
-
255
-
256
-
257
-
258
-
259
-
260
-
261
-
262
-
263
-
264
-
265
-
266
-
267
-
268
-
269
-
270
-
271
-
272
-
273
-
274
-
275
-
276
-
277
-
278
-
279
-
280
-
281
-
282
-
283
 |
 |

Additionally segment profit in 2003 was adversely impacted by temporary plant shutdowns in our Fluorocarbons and Nylon System
businesses. Specialty Materials segment profit in 2003 increased by 51 percent compared with 2002 due mainly to the impact of the
prior year write-down of property, plant and equipment in several businesses, the benefits of cost actions including synergies from the
nylon transaction, divestitures of non-strategic businesses and higher sales volumes. The increase was partially offset by higher raw
material costs (mainly natural gas and phenol resulting from increases in benzene prices) and the impact of the temporary plant
shutdowns in our Fluorocarbons and Nylon System businesses.
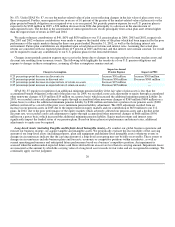
Trends which may impact Specialty Materials operating results in 2005 include:
• Continued excess global capacity in the production of nylon. The Nylon System business did not perform in accordance with
our operating plan in 2004. We have taken certain repositioning actions in 2004 (see repositioning section of this MD&A)
and are evaluating other alternatives. Additionally, we continue to evaluate strategic alternatives to maximize the value of
this business.
• Degree of volatility in significant raw material costs (natural gas and benzene).
• Extent of change in order rates from global semiconductor customers.
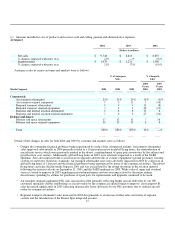
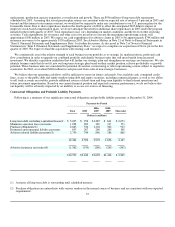
Transportation Systems
2004 2003 2002
(Dollars in millions)
Net sales $ 4,323 $ 3,650 $ 3,184
% change compared with prior year 18% 15% (8)%
Segment profit $ 575 $ 461 $ 393
% change compared with prior year 25% 17% 28%
Transportation Systems sales in 2004 increased by 18 percent compared with 2003 due primarily to a favorable sales mix and
higher volumes of 12 percent and the favorable effect of foreign exchange of 6 percent. The increase in sales for the segment resulted
principally from a 29 percent increase in sales in our Honeywell Turbo Technologies business due to a favorable sales mix and
volume growth driven by increasing diesel penetration in Europe and strength in the North American truck segment, and the favorable
effect of foreign exchange. Sales for our Consumer Products Group business increased by 7 percent driven by strong retail demand for
our high-end products and recent introductions of new Autolite, FRAM and Prestone products and the favorable effect of foreign
exchange and higher prices (offsetting incremental ethylene glycol raw material costs). Sales for our Friction Materials business
increased by 7 percent largely due to the favorable effect of foreign exchange. Transportation Systems sales in 2003 increased by 15
percent compared with 2002 due mainly to the favorable effects of foreign exchange of 9 percent and a favorable sales mix and
volume growth of 5 percent. The increase resulted mainly from a 27 percent increase in sales in our Honeywell Turbo Technologies
business due to a favorable sales mix and volume growth of 15 percent as worldwide demand for our turbochargers continued to be
strong and the favorable effect of foreign exchange of 12 percent.
Transportation Systems segment profit in 2004 increased by 25 percent compared with 2003 due primarily to the effect of
favorable sales mix and volume growth in our Honeywell Turbo Technologies business partially offset by higher raw material costs
(mostly steel and other metals in each of the segment's businesses and ethylene glycol in our Consumer Products Group business).
Transportation Systems segment profit in 2003 increased by 17 percent compared with 2002 as the effect of higher sales in our
Honeywell Turbo Technologies business was partially offset by higher new product development and introduction and facility
relocations expenses, and lower aftermarket sales at our Friction Materials business.
Trends which may impact Transportation Systems operating results in 2005 include:
30