Honeywell 2004 Annual Report Download - page 77
Download and view the complete annual report
Please find page 77 of the 2004 Honeywell annual report below. You can navigate through the pages in the report by either clicking on the pages listed below, or by using the keyword search tool below to find specific information within the annual report.-
 1
1 -
2
-
3
-
4
-
5
-
6
-
7
-
8
-
9
-
10
-
11
-
12
-
13
-
14
-
15
-
16
-
17
-
18
-
19
-
20
-
21
-
22
-
23
-
24
-
25
-
26
-
27
-
28
-
29
-
30
-
31
-
32
-
33
-
34
-
35
-
36
-
37
-
38
-
39
-
40
-
41
-
42
-
43
-
44
-
45
-
46
-
47
-
48
-
49
-
50
-
51
-
52
-
53
-
54
-
55
-
56
-
57
-
58
-
59
-
60
-
61
-
62
-
63
-
64
-
65
-
66
-
 67
67 -
 68
68 -
 69
69 -
 70
70 -
 71
71 -
 72
72 -
 73
73 -
 74
74 -
 75
75 -
 76
76 -
 77
77 -
 78
78 -
 79
79 -
 80
80 -
 81
81 -
 82
82 -
 83
83 -
 84
84 -
 85
85 -
 86
86 -
 87
87 -
88
-
89
-
90
-
91
-
92
-
93
-
94
-
95
-
96
-
97
-
98
-
99
-
100
-
101
-
102
-
103
-
104
-
105
-
106
-
107
-
108
-
109
-
110
-
111
-
112
-
113
-
114
-
115
-
116
-
117
-
118
-
119
-
120
-
121
-
122
-
123
-
124
-
125
-
126
-
127
-
128
-
129
-
130
-
131
-
132
-
133
-
134
-
135
-
136
-
137
-
138
-
139
-
140
-
141
-
142
-
143
-
144
-
145
-
146
-
147
-
148
-
149
-
150
-
151
-
152
-
153
-
154
-
155
-
156
-
157
-
158
-
159
-
160
-
161
-
162
-
163
-
164
-
165
-
166
-
167
-
168
-
169
-
170
-
171
-
172
-
173
-
174
-
175
-
176
-
177
-
178
-
179
-
180
-
181
-
182
-
183
-
184
-
185
-
186
-
187
-
188
-
189
-
190
-
191
-
192
-
193
-
194
-
195
-
196
-
197
-
198
-
199
-
200
-
201
-
202
-
203
-
204
-
205
-
206
-
207
-
208
-
209
-
210
-
211
-
212
-
213
-
214
-
215
-
216
-
217
-
218
-
219
-
220
-
221
-
222
-
223
-
224
-
225
-
226
-
227
-
228
-
229
-
230
-
231
-
232
-
233
-
234
-
235
-
236
-
237
-
238
-
239
-
240
-
241
-
242
-
243
-
244
-
245
-
246
-
247
-
248
-
249
-
250
-
251
-
252
-
253
-
254
-
255
-
256
-
257
-
258
-
259
-
260
-
261
-
262
-
263
-
264
-
265
-
266
-
267
-
268
-
269
-
270
-
271
-
272
-
273
-
274
-
275
-
276
-
277
-
278
-
279
-
280
-
281
-
282
-
283
 |
 |

HONEYWELL INTERNATIONAL INC.
NOTES TO FINANCIAL STATEMENTS—(Continued)
(Dollars in millions, except per share amounts)
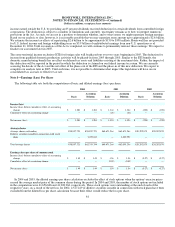
Note 4—Gain (Loss) on Sale of Non-Strategic Businesses
The following is a summary of non-strategic businesses sold:
Year Ended
December 31, 2004
Pretax
Gain (Loss) After-tax
Gain (Loss)
Automation and Control Solutions—Security Monitoring and VSCEL Optical Products $ 251 $ 133
Specialty Materials—Performance Fibers (15) (3)
Adjustments related to businesses sold in prior years 19 14
$ 255 $ 144
In 2004, we realized proceeds of $426 million in cash on the sale of these businesses. The sales of these businesses did not
materially impact net sales and segment profit in 2004 compared with 2003.
Year Ended
December 31, 2003
Pretax
Gain (Loss) After-tax
Gain (Loss)
Specialty Materials—Engineering Plastics, Rudolstadt and Metglas $ 25 $ (5)
Aerospace—Honeywell Aerospace Defense Services 13 9
$ 38 $ 4
In 2003, we realized proceeds of $137 million in cash on the sales of these businesses. The sales of these businesses did not
materially impact net sales and segment profit in 2003 compared with 2002. The after-tax loss on the sale of our Specialty Materials'
businesses resulted mainly from tax benefits associated with prior capital losses.
Year Ended
December 31, 2002
Pretax
Gain (Loss) After-tax
Gain (Loss)
Automation and Control Solutions—Consumer Products $ (131) $ (10)
Specialty Materials—Advanced Circuits (83) 18
Specialty Materials—Pharmaceutical Fine Chemicals (PFC) (35) 108
Transportation Systems—Bendix Commercial Vehicle Systems (BCVS) 125 79
$ (124) $ 195
In 2002, we realized proceeds of approximately $435 million in cash and investment securities on the sales of these businesses.
Our Advanced Circuits and PFC businesses had a higher deductible tax basis than book basis which resulted in an after-tax gain. The
sales of these businesses reduced net sales and increased segment profit in 2002 compared with 2001 by approximately $500 and $31
million, respectively.
57