Honeywell 2004 Annual Report Download - page 41
Download and view the complete annual report
Please find page 41 of the 2004 Honeywell annual report below. You can navigate through the pages in the report by either clicking on the pages listed below, or by using the keyword search tool below to find specific information within the annual report.-
 1
1 -
2
-
3
-
4
-
5
-
6
-
7
-
8
-
9
-
10
-
11
-
12
-
13
-
14
-
15
-
16
-
17
-
18
-
19
-
20
-
21
-
22
-
23
-
24
-
25
-
26
-
27
-
28
-
29
-
30
-
 31
31 -
 32
32 -
 33
33 -
 34
34 -
 35
35 -
 36
36 -
 37
37 -
 38
38 -
 39
39 -
 40
40 -
 41
41 -
 42
42 -
 43
43 -
 44
44 -
 45
45 -
 46
46 -
 47
47 -
 48
48 -
 49
49 -
 50
50 -
 51
51 -
52
-
53
-
54
-
55
-
56
-
57
-
58
-
59
-
60
-
61
-
62
-
63
-
64
-
65
-
66
-
67
-
68
-
69
-
70
-
71
-
72
-
73
-
74
-
75
-
76
-
77
-
78
-
79
-
80
-
81
-
82
-
83
-
84
-
85
-
86
-
87
-
88
-
89
-
90
-
91
-
92
-
93
-
94
-
95
-
96
-
97
-
98
-
99
-
100
-
101
-
102
-
103
-
104
-
105
-
106
-
107
-
108
-
109
-
110
-
111
-
112
-
113
-
114
-
115
-
116
-
117
-
118
-
119
-
120
-
121
-
122
-
123
-
124
-
125
-
126
-
127
-
128
-
129
-
130
-
131
-
132
-
133
-
134
-
135
-
136
-
137
-
138
-
139
-
140
-
141
-
142
-
143
-
144
-
145
-
146
-
147
-
148
-
149
-
150
-
151
-
152
-
153
-
154
-
155
-
156
-
157
-
158
-
159
-
160
-
161
-
162
-
163
-
164
-
165
-
166
-
167
-
168
-
169
-
170
-
171
-
172
-
173
-
174
-
175
-
176
-
177
-
178
-
179
-
180
-
181
-
182
-
183
-
184
-
185
-
186
-
187
-
188
-
189
-
190
-
191
-
192
-
193
-
194
-
195
-
196
-
197
-
198
-
199
-
200
-
201
-
202
-
203
-
204
-
205
-
206
-
207
-
208
-
209
-
210
-
211
-
212
-
213
-
214
-
215
-
216
-
217
-
218
-
219
-
220
-
221
-
222
-
223
-
224
-
225
-
226
-
227
-
228
-
229
-
230
-
231
-
232
-
233
-
234
-
235
-
236
-
237
-
238
-
239
-
240
-
241
-
242
-
243
-
244
-
245
-
246
-
247
-
248
-
249
-
250
-
251
-
252
-
253
-
254
-
255
-
256
-
257
-
258
-
259
-
260
-
261
-
262
-
263
-
264
-
265
-
266
-
267
-
268
-
269
-
270
-
271
-
272
-
273
-
274
-
275
-
276
-
277
-
278
-
279
-
280
-
281
-
282
-
283
 |
 |

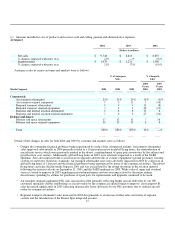
system. Regional aftermarket sales decreased in 2003 due mainly to lower sales of spare parts to regional airline operators.
• Business and general aviation aftermarket sales were higher in 2004 as an improving economy drove increased utilization of
corporate aircraft. Also, there was an increase in upgrade activity in avionics equipment (RVSM) to meet new regulatory
standards. Business and general aviation aftermarket sales also increased in 2003 largely due to higher repair and overhaul
activity in the fractional jet market.
• Business and general aviation OE sales improved in 2004 due primarily to deliveries of the Primus Epic integrated avionics
system and HTF7000 engine to business jet OE manufacturers. Business and general aviation OE sales were lower in 2003
reflecting a decline in projected deliveries of business jet airplanes due to weakness in the demand for fractional interests in
aircraft and corporate profitability.
• Defense and space OE sales increased in both 2004 and 2003 due principally to war-related activities, continued growth in
precision munitions and increases in restricted space programs.
• Defense and space aftermarket sales were strong in both 2004 and 2003 driven by war-related activities resulting in increases
in repairs, platform upgrades and modifications for fixed, rotary wing and ground vehicles.
Aerospace segment profit in 2004 increased by 21 percent compared with 2003 due primarily to an increase in sales of higher
margin commercial aftermarket products and services and volume growth. This increase was partially offset by higher development
expense associated with new programs and an increase in spending for information technology systems. Aerospace segment profit in
2003 decreased by 7 percent compared with 2002 due mainly to lower sales of commercial original equipment and higher-margin
commercial aftermarket spare parts.
Trends which may impact Aerospace operating results in 2005 include:
• Global flying hours improved by 10 percent in 2004 and are expected to increase again in 2005 (5 to 6 percent).
• The financial condition of major commercial airlines continues to be a concern due mainly to high fuel costs and intense fare
competition.
• The extent to which increased military activity is offset by lower OE sales due to program completions and reductions.
• The magnitude of an expected increase in aircraft orders and deliveries in the air transport, business and general aviation
segments.
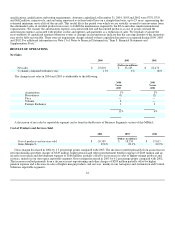
Automation and Control Solutions
2004 2003 2002
(Dollars in millions)
Net sales $ 8,031 $ 7,464 $ 6,978
% change compared with prior year 8% 7% (3)%
Segment profit $ 894 $ 843 $ 860
% change compared with prior year 6% (2)% 11%
Automation and Control Solutions sales in 2004 increased by 8 percent compared with 2003 due to higher volumes of 5 percent
and the favorable effect of foreign exchange of 4 percent, partially offset by the impact of lower prices of 1 percent. Sales increased by
9 percent for our Automation and Control Products businesses due principally to strong sales of fire solutions, environmental controls
and sensor products, and the favorable effects of foreign exchange and acquisitions. Sales for our Process Solutions business increased
by 8 percent due primarily to the favorable effect of foreign exchange and improvement in industrial production and capital spending.
Sales for our Building Solutions business increased by 5 percent due primarily to the favorable effect of foreign exchange and the
impact of investments in sales and marketing initiatives, partially offset by the divestiture of our Security
28