Honeywell 2004 Annual Report Download - page 116
Download and view the complete annual report
Please find page 116 of the 2004 Honeywell annual report below. You can navigate through the pages in the report by either clicking on the pages listed below, or by using the keyword search tool below to find specific information within the annual report.-
 1
1 -
2
-
3
-
4
-
5
-
6
-
7
-
8
-
9
-
10
-
11
-
12
-
13
-
14
-
15
-
16
-
17
-
18
-
19
-
20
-
21
-
22
-
23
-
24
-
25
-
26
-
27
-
28
-
29
-
30
-
31
-
32
-
33
-
34
-
35
-
36
-
37
-
38
-
39
-
40
-
41
-
42
-
43
-
44
-
45
-
46
-
47
-
48
-
49
-
50
-
51
-
52
-
53
-
54
-
55
-
56
-
57
-
58
-
59
-
60
-
61
-
62
-
63
-
64
-
65
-
66
-
67
-
68
-
69
-
70
-
71
-
72
-
73
-
74
-
75
-
76
-
77
-
78
-
79
-
80
-
81
-
82
-
83
-
84
-
85
-
86
-
87
-
88
-
89
-
90
-
91
-
92
-
93
-
94
-
95
-
96
-
97
-
98
-
99
-
100
-
101
-
102
-
103
-
104
-
105
-
 106
106 -
 107
107 -
 108
108 -
 109
109 -
 110
110 -
 111
111 -
 112
112 -
 113
113 -
 114
114 -
 115
115 -
 116
116 -
 117
117 -
 118
118 -
 119
119 -
 120
120 -
 121
121 -
 122
122 -
 123
123 -
 124
124 -
 125
125 -
 126
126 -
127
-
128
-
129
-
130
-
131
-
132
-
133
-
134
-
135
-
136
-
137
-
138
-
139
-
140
-
141
-
142
-
143
-
144
-
145
-
146
-
147
-
148
-
149
-
150
-
151
-
152
-
153
-
154
-
155
-
156
-
157
-
158
-
159
-
160
-
161
-
162
-
163
-
164
-
165
-
166
-
167
-
168
-
169
-
170
-
171
-
172
-
173
-
174
-
175
-
176
-
177
-
178
-
179
-
180
-
181
-
182
-
183
-
184
-
185
-
186
-
187
-
188
-
189
-
190
-
191
-
192
-
193
-
194
-
195
-
196
-
197
-
198
-
199
-
200
-
201
-
202
-
203
-
204
-
205
-
206
-
207
-
208
-
209
-
210
-
211
-
212
-
213
-
214
-
215
-
216
-
217
-
218
-
219
-
220
-
221
-
222
-
223
-
224
-
225
-
226
-
227
-
228
-
229
-
230
-
231
-
232
-
233
-
234
-
235
-
236
-
237
-
238
-
239
-
240
-
241
-
242
-
243
-
244
-
245
-
246
-
247
-
248
-
249
-
250
-
251
-
252
-
253
-
254
-
255
-
256
-
257
-
258
-
259
-
260
-
261
-
262
-
263
-
264
-
265
-
266
-
267
-
268
-
269
-
270
-
271
-
272
-
273
-
274
-
275
-
276
-
277
-
278
-
279
-
280
-
281
-
282
-
283
 |
 |

HONEYWELL INTERNATIONAL INC.
NOTES TO FINANCIAL STATEMENTS—(Continued)
(Dollars in millions, except per share amounts)
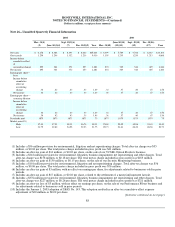
Note 26—Unaudited Quarterly Financial Information
2004 2003
Mar. 31(1)
(2) June 30(3)(4) Sept. 30(5)(6)
(7) Dec. 31(8)(9) Year Mar. 31(10) June 30(11)
(12)(13) Sept. 30(14)
(15) Dec. 31(16)
(17) Year
Net sales $ 6,178 $ 6,388 $ 6,395 $ 6,640 $25,601 $ 5,399 $ 5,749 $ 5,768 $ 6,187 $23,103
Gross profit 1,259 1,209 1,332 1,216 5,016 1,159 1,235 1,259 1,215 4,868
Income before
cumulative effect
of
accounting change
295
361
372
253
1,281
274
319
344
407
1,344
Net income 295 361 372 253 1,281 254 319 344 407 1,324
Earnings per share—
basic:
Income before
cumulative
effect of
accounting
change
.34
.42
.43
.30
1.49
.32
.37
.40
.47
1.56
Net income .34 .42 .43 .30 1.49 .30 .37 .40 .47 1.54
Earnings per share—
assuming dilution:
Income before
cumulative
effect of
accounting
change
.34
.42
.43
.30
1.49
.32
.37
.40
.47
1.56
Net income .34 .42 .43 .30 1.49 .30 .37 .40 .47 1.54
Dividends paid .1875 .1875 .1875 .1875 .75 .1875 .1875 .1875 .1875 .75
Market price(18)
High 37.43 37.51 38.11 36.76 38.11 25.65 29.02 30.06 33.43 33.43
Low 31.75 32.60 34.58 32.23 31.75 20.73 21.61 26.22 26.56 20.73
(1) Includes a $56 million provision for environmental, litigation and net repositioning charges. Total after-tax charge was $35
million, or $0.04 per share. The total pretax charge included in gross profit was $41 million.
(2) Includes an after-tax gain of $14 million, or $0.02 per share, on the sale of our VCSEL Optical Products business.
(3) Includes a $242 million provision for environmental, litigation, business impairment, net repositioning and other charges. Total
after-tax charge was $158 million, or $0.18 per share. The total pretax charge included in gross profit was $183 million.
(4) Includes an after-tax gain of $130 million, or $0.15 per share, on the sale of our Security Monitoring business.
(5) Includes a $101 million provision for environmental, litigation and net repositioning charges. Total after-tax charge was $56
million, or $0.06 per share. The total pretax charge included in gross profit was $76 million.
(6) Includes an after-tax gain of $3 million, with no effect on earnings per share, for adjustments related to businesses sold in prior
periods.
(7) Includes an after-tax gain of $17 million, or $0.02 per share, related to the settlement of a patent infringement lawsuit.
(8) Includes a $376 million provision for environmental, litigation, business impairment, net repositioning and other charges. Total
after-tax charge was $227 million, or $0.26 per share. The total pretax charge included in gross profit was $321 million.
(9) Includes an after-tax loss of $3 million, with no effect on earnings per share, on the sale of our Performance Fibers business and
for adjustments related to businesses sold in prior periods.
(10) Includes the January 1, 2003 adoption of SFAS No. 143. This adoption resulted in an after-tax cumulative effect expense
adjustment of $20 million, or $0.02 per share. (footnotes continued on next page)
88