Honeywell 2004 Annual Report Download - page 56
Download and view the complete annual report
Please find page 56 of the 2004 Honeywell annual report below. You can navigate through the pages in the report by either clicking on the pages listed below, or by using the keyword search tool below to find specific information within the annual report.-
 1
1 -
2
-
3
-
4
-
5
-
6
-
7
-
8
-
9
-
10
-
11
-
12
-
13
-
14
-
15
-
16
-
17
-
18
-
19
-
20
-
21
-
22
-
23
-
24
-
25
-
26
-
27
-
28
-
29
-
30
-
31
-
32
-
33
-
34
-
35
-
36
-
37
-
38
-
39
-
40
-
41
-
42
-
43
-
44
-
45
-
 46
46 -
 47
47 -
 48
48 -
 49
49 -
 50
50 -
 51
51 -
 52
52 -
 53
53 -
 54
54 -
 55
55 -
 56
56 -
 57
57 -
 58
58 -
 59
59 -
 60
60 -
 61
61 -
 62
62 -
 63
63 -
 64
64 -
 65
65 -
 66
66 -
67
-
68
-
69
-
70
-
71
-
72
-
73
-
74
-
75
-
76
-
77
-
78
-
79
-
80
-
81
-
82
-
83
-
84
-
85
-
86
-
87
-
88
-
89
-
90
-
91
-
92
-
93
-
94
-
95
-
96
-
97
-
98
-
99
-
100
-
101
-
102
-
103
-
104
-
105
-
106
-
107
-
108
-
109
-
110
-
111
-
112
-
113
-
114
-
115
-
116
-
117
-
118
-
119
-
120
-
121
-
122
-
123
-
124
-
125
-
126
-
127
-
128
-
129
-
130
-
131
-
132
-
133
-
134
-
135
-
136
-
137
-
138
-
139
-
140
-
141
-
142
-
143
-
144
-
145
-
146
-
147
-
148
-
149
-
150
-
151
-
152
-
153
-
154
-
155
-
156
-
157
-
158
-
159
-
160
-
161
-
162
-
163
-
164
-
165
-
166
-
167
-
168
-
169
-
170
-
171
-
172
-
173
-
174
-
175
-
176
-
177
-
178
-
179
-
180
-
181
-
182
-
183
-
184
-
185
-
186
-
187
-
188
-
189
-
190
-
191
-
192
-
193
-
194
-
195
-
196
-
197
-
198
-
199
-
200
-
201
-
202
-
203
-
204
-
205
-
206
-
207
-
208
-
209
-
210
-
211
-
212
-
213
-
214
-
215
-
216
-
217
-
218
-
219
-
220
-
221
-
222
-
223
-
224
-
225
-
226
-
227
-
228
-
229
-
230
-
231
-
232
-
233
-
234
-
235
-
236
-
237
-
238
-
239
-
240
-
241
-
242
-
243
-
244
-
245
-
246
-
247
-
248
-
249
-
250
-
251
-
252
-
253
-
254
-
255
-
256
-
257
-
258
-
259
-
260
-
261
-
262
-
263
-
264
-
265
-
266
-
267
-
268
-
269
-
270
-
271
-
272
-
273
-
274
-
275
-
276
-
277
-
278
-
279
-
280
-
281
-
282
-
283
 |
 |

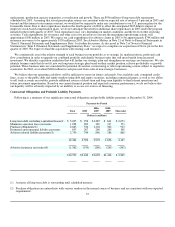
a 20 percent decrease in the price of the underlying commodity across all maturities at December 31, 2004 and 2003.
Face or
Notional
Amount
Carrying
Value(1)
Fair
Value(1)
Estimated
Increase
(Decrease)
In Fair Value
(Dollars in millions)
December 31, 2004
Interest Rate Sensitive Instruments
Long-term debt (including current maturities) $ (4,994) $ (5,025) $ (5,411) $ (131)
Interest rate swap agreements 1,218 39 39 (15)
Foreign Exchange Rate Sensitive Instruments
Foreign currency exchange contracts(2) 790 16 16 (21)
Commodity Price Sensitive Instruments
Forward commodity contracts(3) 87 8 8 (11)
December 31, 2003
Interest Rate Sensitive Instruments
Long-term debt (including current maturities) $ (4,947) $ (5,008) $ (5,508) $ (148)
Interest rate swap agreements 1,189 67 67 (26)
Foreign Exchange Rate Sensitive Instruments
Foreign currency exchange contracts(2) 641 1 1 (32)
Commodity Price Sensitive Instruments
Forward commodity contracts(3) 50 18 18 (13)
(1) Asset or (liability).
(2) Changes in the fair value of foreign currency exchange contracts are offset by changes in the fair value or cash flows of
underlying hedged foreign currency transactions.
(3) Changes in the fair value of forward commodity contracts are offset by changes in the cash flows of underlying hedged
commodity transactions.
The above discussion of our procedures to monitor market risk and the estimated changes in fair value resulting from our
sensitivity analyses are forward-looking statements of market risk assuming certain adverse market conditions occur. Actual results in
the future may differ materially from these estimated results due to actual developments in the global financial markets. The methods
used by us to assess and mitigate risk discussed above should not be considered projections of future events.
OTHER MATTERS
Litigation
See Note 21 of Notes to Financial Statements in “Item 8. Financial Statements and Supplementary Data” for a discussion of
environmental, asbestos and other litigation matters.
Sales to the U.S. Government
Sales to the U.S. Government, acting through its various departments and agencies and through prime contractors, amounted to
$3,464, $3,111 and $2,730 million in 2004, 2003 and 2002, respectively. This included sales to the Department of Defense (DoD), as
a prime contractor and subcontractor, of $2,808, $2,564 and $2,046 million in 2004, 2003 and 2002, respectively. Sales to the DoD
accounted for 11.0, 11.1 and 9.2 percent of our total sales in 2004, 2003 and 2002, respectively. U.S. defense spending increased in
2004 and is also expected to increase in 2005.
41