Honeywell 2004 Annual Report Download - page 80
Download and view the complete annual report
Please find page 80 of the 2004 Honeywell annual report below. You can navigate through the pages in the report by either clicking on the pages listed below, or by using the keyword search tool below to find specific information within the annual report.-
 1
1 -
2
-
3
-
4
-
5
-
6
-
7
-
8
-
9
-
10
-
11
-
12
-
13
-
14
-
15
-
16
-
17
-
18
-
19
-
20
-
21
-
22
-
23
-
24
-
25
-
26
-
27
-
28
-
29
-
30
-
31
-
32
-
33
-
34
-
35
-
36
-
37
-
38
-
39
-
40
-
41
-
42
-
43
-
44
-
45
-
46
-
47
-
48
-
49
-
50
-
51
-
52
-
53
-
54
-
55
-
56
-
57
-
58
-
59
-
60
-
61
-
62
-
63
-
64
-
65
-
66
-
67
-
68
-
69
-
 70
70 -
 71
71 -
 72
72 -
 73
73 -
 74
74 -
 75
75 -
 76
76 -
 77
77 -
 78
78 -
 79
79 -
 80
80 -
 81
81 -
 82
82 -
 83
83 -
 84
84 -
 85
85 -
 86
86 -
 87
87 -
 88
88 -
 89
89 -
 90
90 -
91
-
92
-
93
-
94
-
95
-
96
-
97
-
98
-
99
-
100
-
101
-
102
-
103
-
104
-
105
-
106
-
107
-
108
-
109
-
110
-
111
-
112
-
113
-
114
-
115
-
116
-
117
-
118
-
119
-
120
-
121
-
122
-
123
-
124
-
125
-
126
-
127
-
128
-
129
-
130
-
131
-
132
-
133
-
134
-
135
-
136
-
137
-
138
-
139
-
140
-
141
-
142
-
143
-
144
-
145
-
146
-
147
-
148
-
149
-
150
-
151
-
152
-
153
-
154
-
155
-
156
-
157
-
158
-
159
-
160
-
161
-
162
-
163
-
164
-
165
-
166
-
167
-
168
-
169
-
170
-
171
-
172
-
173
-
174
-
175
-
176
-
177
-
178
-
179
-
180
-
181
-
182
-
183
-
184
-
185
-
186
-
187
-
188
-
189
-
190
-
191
-
192
-
193
-
194
-
195
-
196
-
197
-
198
-
199
-
200
-
201
-
202
-
203
-
204
-
205
-
206
-
207
-
208
-
209
-
210
-
211
-
212
-
213
-
214
-
215
-
216
-
217
-
218
-
219
-
220
-
221
-
222
-
223
-
224
-
225
-
226
-
227
-
228
-
229
-
230
-
231
-
232
-
233
-
234
-
235
-
236
-
237
-
238
-
239
-
240
-
241
-
242
-
243
-
244
-
245
-
246
-
247
-
248
-
249
-
250
-
251
-
252
-
253
-
254
-
255
-
256
-
257
-
258
-
259
-
260
-
261
-
262
-
263
-
264
-
265
-
266
-
267
-
268
-
269
-
270
-
271
-
272
-
273
-
274
-
275
-
276
-
277
-
278
-
279
-
280
-
281
-
282
-
283
 |
 |

HONEYWELL INTERNATIONAL INC.
NOTES TO FINANCIAL STATEMENTS—(Continued)
(Dollars in millions, except per share amounts)
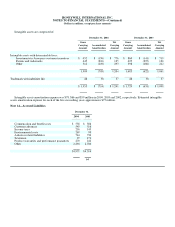
Deferred tax assets (liabilities)
December 31,
2004 2003
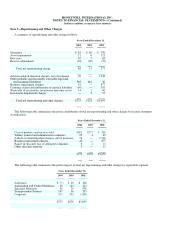
Deferred income taxes represent the future tax effects of transactions which are reported in different periods
for tax and financial reporting purposes. The tax effects of temporary differences and tax carryforwards
which give rise to future income tax benefits and payables are as follows:
Property, plant and equipment basis differences $ (509) $ (570)
Postretirement benefits other than pensions and postemployment benefits 748 707
Investment and other asset basis differences (205) (215)
Other accrued items 558 535
Net operating losses 706 967
Tax credits 440 373
Undistributed earnings of subsidiaries (34) (33)
All other items—net (33) 52
1,671 1,816
Valuation allowance (338) (299)
$1,333 $1,517
The amount of federal tax net operating losses available for carryforward at December 31, 2004 was $213 million, including
$79 million of charitable contributions deductions converted to federal net operating losses under the Internal Revenue Code. Also,
included are $86 million of loss carryforwards that were generated by certain subsidiaries prior to their acquisition and have expiration
dates through 2022. The use of pre-acquisition operating losses is subject to limitations imposed by the Internal Revenue Code. We do
not anticipate that these limitations will affect utilization of the carryforwards prior to their expiration. Various subsidiaries have state
tax net operating loss carryforwards of $3.5 billion at December 31, 2004 with varying expiration dates through 2024. We also have
foreign net operating losses of $1.9 billion which are available to reduce future income tax payments in several countries, subject to
varying expiration rules.
We have U.S. tax credit carryforwards of $170 million at December 31, 2004, including carryforwards of $90 million with various
expiration dates through 2024, and tax credits of $80 million which are not subject to expiration. In addition, we have $270 million of
foreign tax credits available for carryback or carryforward at December 31, 2004 with varying expiration dates through 2014.
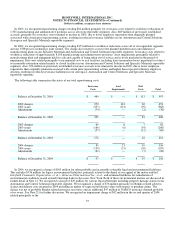
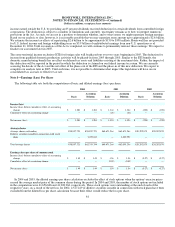
The valuation allowance was increased by $39, $108 and $80 million in 2004, 2003 and 2002, respectively. The increase in 2004
was primarily due to an increase in state tax net operating loss carryforwards (net of federal impact) and foreign net operating and
capital losses that are not expected to be realized of $40 and $27 million, respectively, offset by a decrease of $30 million for foreign
tax credits which we now believe will be utilized due to the extension of the foreign tax credit carryforward period from five to 10
years under the American Jobs Creation Act of 2004. The increase in 2003 was primarily due to an increase in foreign net operating
losses that are not expected to be utilized. The increase in 2002 was primarily due to foreign tax credits which are not expected to be
realized and state tax net operating loss carryforwards (net of federal impact) which we believe will expire unutilized.
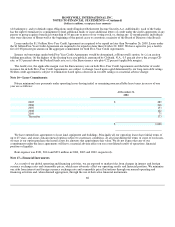
The American Jobs Creation Act of 2004, signed into law in October 2004, provides for a variety of changes in the tax law
including incentives to repatriate undistributed earnings of foreign subsidiaries, a phased elimination of the extra-territorial income
exclusion, and a domestic manufacturing benefit. More specifically, the Act creates a temporary incentive for U.S. corporations to
repatriate accumulated
60