Honeywell 2004 Annual Report Download - page 48
Download and view the complete annual report
Please find page 48 of the 2004 Honeywell annual report below. You can navigate through the pages in the report by either clicking on the pages listed below, or by using the keyword search tool below to find specific information within the annual report.-
 1
1 -
2
-
3
-
4
-
5
-
6
-
7
-
8
-
9
-
10
-
11
-
12
-
13
-
14
-
15
-
16
-
17
-
18
-
19
-
20
-
21
-
22
-
23
-
24
-
25
-
26
-
27
-
28
-
29
-
30
-
31
-
32
-
33
-
34
-
35
-
36
-
37
-
 38
38 -
 39
39 -
 40
40 -
 41
41 -
 42
42 -
 43
43 -
 44
44 -
 45
45 -
 46
46 -
 47
47 -
 48
48 -
 49
49 -
 50
50 -
 51
51 -
 52
52 -
 53
53 -
 54
54 -
 55
55 -
 56
56 -
 57
57 -
 58
58 -
59
-
60
-
61
-
62
-
63
-
64
-
65
-
66
-
67
-
68
-
69
-
70
-
71
-
72
-
73
-
74
-
75
-
76
-
77
-
78
-
79
-
80
-
81
-
82
-
83
-
84
-
85
-
86
-
87
-
88
-
89
-
90
-
91
-
92
-
93
-
94
-
95
-
96
-
97
-
98
-
99
-
100
-
101
-
102
-
103
-
104
-
105
-
106
-
107
-
108
-
109
-
110
-
111
-
112
-
113
-
114
-
115
-
116
-
117
-
118
-
119
-
120
-
121
-
122
-
123
-
124
-
125
-
126
-
127
-
128
-
129
-
130
-
131
-
132
-
133
-
134
-
135
-
136
-
137
-
138
-
139
-
140
-
141
-
142
-
143
-
144
-
145
-
146
-
147
-
148
-
149
-
150
-
151
-
152
-
153
-
154
-
155
-
156
-
157
-
158
-
159
-
160
-
161
-
162
-
163
-
164
-
165
-
166
-
167
-
168
-
169
-
170
-
171
-
172
-
173
-
174
-
175
-
176
-
177
-
178
-
179
-
180
-
181
-
182
-
183
-
184
-
185
-
186
-
187
-
188
-
189
-
190
-
191
-
192
-
193
-
194
-
195
-
196
-
197
-
198
-
199
-
200
-
201
-
202
-
203
-
204
-
205
-
206
-
207
-
208
-
209
-
210
-
211
-
212
-
213
-
214
-
215
-
216
-
217
-
218
-
219
-
220
-
221
-
222
-
223
-
224
-
225
-
226
-
227
-
228
-
229
-
230
-
231
-
232
-
233
-
234
-
235
-
236
-
237
-
238
-
239
-
240
-
241
-
242
-
243
-
244
-
245
-
246
-
247
-
248
-
249
-
250
-
251
-
252
-
253
-
254
-
255
-
256
-
257
-
258
-
259
-
260
-
261
-
262
-
263
-
264
-
265
-
266
-
267
-
268
-
269
-
270
-
271
-
272
-
273
-
274
-
275
-
276
-
277
-
278
-
279
-
280
-
281
-
282
-
283
 |
 |

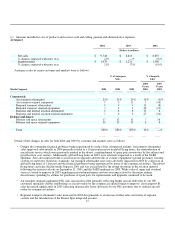
Specialty Materials
2004 2003 2002
(Dollars in millions)
Net repositioning charge $ 36 $ 16 $ 167
Other probable and reasonably estimable legal and
environmental liabilities 9 — 23
Business impairment charges 42 — 763
Customer claims and settlements of contract liabilities — — 11
Write-offs of receivables, inventories and other assets 3 2 12
Investment impairment charges — 2 —
$ 90 $ 20 $ 976
Transportation Systems
2004 2003 2002
(Dollars in millions)
Net repositioning charge $ 26 $ 5 $ 26
Asbestos related litigation charges, net of insurance 120 — 167
Other probable and reasonably estimable legal and environmental liabilities — 11 —
Business impairment charges — — 92
Write-offs of receivables, inventories and other assets 1 — 10
$ 147 $ 16 $ 295
Corporate
2004 2003 2002
(Dollars in millions)
Net repositioning charge $ 6 $ 4 $ 38
Asbestos related litigation charges, net of insurance (44) — 1,381
Other probable and reasonably estimable legal and environmental liabilities 543 250 7
Write-offs of receivables, inventories and other assets 10 — —
Investment impairment charges — — 4
$ 515 $ 254 $ 1,430
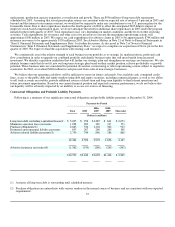
LIQUIDITY AND CAPITAL RESOURCES
Cash Flow Summary
Our cash flows from operating, investing and financing activities, as reflected in the Consolidated Statement of Cash Flows, are
summarized as follows:
2004 2003 2002
(Dollars in millions)
Cash provided by (used for):
Operating activities $ 2,253 $ 2,199 $ 2,380
Investing activities (584) (680) (870)
Financing activities (1,223) (895) (932)
Effect of exchange rate changes on cash 190 305 50
Net increase in cash and cash equivalents $ 636 $ 929 $ 628