Honeywell 2004 Annual Report Download - page 33
Download and view the complete annual report
Please find page 33 of the 2004 Honeywell annual report below. You can navigate through the pages in the report by either clicking on the pages listed below, or by using the keyword search tool below to find specific information within the annual report.-
 1
1 -
2
-
3
-
4
-
5
-
6
-
7
-
8
-
9
-
10
-
11
-
12
-
13
-
14
-
15
-
16
-
17
-
18
-
19
-
20
-
21
-
22
-
 23
23 -
 24
24 -
 25
25 -
 26
26 -
 27
27 -
 28
28 -
 29
29 -
 30
30 -
 31
31 -
 32
32 -
 33
33 -
 34
34 -
 35
35 -
 36
36 -
 37
37 -
 38
38 -
 39
39 -
 40
40 -
 41
41 -
 42
42 -
 43
43 -
44
-
45
-
46
-
47
-
48
-
49
-
50
-
51
-
52
-
53
-
54
-
55
-
56
-
57
-
58
-
59
-
60
-
61
-
62
-
63
-
64
-
65
-
66
-
67
-
68
-
69
-
70
-
71
-
72
-
73
-
74
-
75
-
76
-
77
-
78
-
79
-
80
-
81
-
82
-
83
-
84
-
85
-
86
-
87
-
88
-
89
-
90
-
91
-
92
-
93
-
94
-
95
-
96
-
97
-
98
-
99
-
100
-
101
-
102
-
103
-
104
-
105
-
106
-
107
-
108
-
109
-
110
-
111
-
112
-
113
-
114
-
115
-
116
-
117
-
118
-
119
-
120
-
121
-
122
-
123
-
124
-
125
-
126
-
127
-
128
-
129
-
130
-
131
-
132
-
133
-
134
-
135
-
136
-
137
-
138
-
139
-
140
-
141
-
142
-
143
-
144
-
145
-
146
-
147
-
148
-
149
-
150
-
151
-
152
-
153
-
154
-
155
-
156
-
157
-
158
-
159
-
160
-
161
-
162
-
163
-
164
-
165
-
166
-
167
-
168
-
169
-
170
-
171
-
172
-
173
-
174
-
175
-
176
-
177
-
178
-
179
-
180
-
181
-
182
-
183
-
184
-
185
-
186
-
187
-
188
-
189
-
190
-
191
-
192
-
193
-
194
-
195
-
196
-
197
-
198
-
199
-
200
-
201
-
202
-
203
-
204
-
205
-
206
-
207
-
208
-
209
-
210
-
211
-
212
-
213
-
214
-
215
-
216
-
217
-
218
-
219
-
220
-
221
-
222
-
223
-
224
-
225
-
226
-
227
-
228
-
229
-
230
-
231
-
232
-
233
-
234
-
235
-
236
-
237
-
238
-
239
-
240
-
241
-
242
-
243
-
244
-
245
-
246
-
247
-
248
-
249
-
250
-
251
-
252
-
253
-
254
-
255
-
256
-
257
-
258
-
259
-
260
-
261
-
262
-
263
-
264
-
265
-
266
-
267
-
268
-
269
-
270
-
271
-
272
-
273
-
274
-
275
-
276
-
277
-
278
-
279
-
280
-
281
-
282
-
283
 |
 |

No. 87). Under SFAS No. 87, we use the market-related value of plan assets reflecting changes in the fair value of plan assets over a
three-year period. Further, unrecognized losses in excess of 10 percent of the greater of the market-related value of plan assets or the
plans projected benefit obligation are recognized over a six-year period. Net periodic pension expense for our U.S. pension plans is
expected to be $320 million in 2005, a $56 million decrease from 2004 due principally to a decrease in the amortization of
unrecognized losses. The decline in the amortization of unrecognized losses results principally from actual plan asset returns higher
than the expected rate of return in 2003 and 2004.
We made voluntary contributions of $40, $670 and $830 million to our U.S. pension plans in 2004, 2003 and 2002, respectively.
The 2003 and 2002 voluntary contributions were made to improve the funded status of the plans which had been impacted by the poor
performance of the equity markets during the three-year period ended December 31, 2002, as well as the declining interest rate
environment. Future plan contributions are dependent upon actual plan asset returns and interest rates. Assuming that actual plan
returns are consistent with our expected plan return of 9 percent in 2005 and beyond, and that interest rates remain constant, we would
not be required to make any contributions to our U.S. pension plans for the foreseeable future.
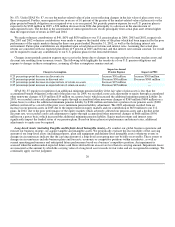
Changes in net periodic pension expense may occur in the future due to changes in our expected rate of return on plan assets and
discount rate resulting from economic events. The following table highlights the sensitivity of our U.S. pension obligations and
expense to changes in these assumptions, assuming all other assumptions remain constant:
Change in Assumption
Impact on Annual
Pension Expense Impact on PBO
0.25 percentage point decrease in discount rate Increase $50 million Increase $300 million
0.25 percentage point increase in discount rate Decrease $50 million Decrease $300 million
0.25 percentage point decrease in expected rate of return on assets Increase $25 million —
0.25 percentage point increase in expected rate of return on assets Decrease $25 million —
SFAS No. 87 requires recognition of an additional minimum pension liability if the fair value of plan assets is less than the
accumulated benefit obligation at the end of the plan year. In 2004, we recorded a non-cash adjustment to equity through accumulated
other nonowner changes of $15 million ($19 million on a pretax basis) which increased the additional minimum pension liability. In
2003, we recorded a non-cash adjustment to equity through accumulated other nonowner changes of $369 million ($604 million on a
pretax basis) to reduce the additional minimum pension liability by $304 million and reinstate a portion of our pension assets ($300
million) written off as a result of the prior year's minimum pension liability adjustment. The 2003 adjustment resulted from an
increase in our pension assets in 2003 due to the improvement in equity markets and our contribution of $670 million to our U.S.
plans. In 2002, due to the poor performance of the equity markets which adversely affected our pension assets and a decline in the
discount rate, we recorded a non-cash adjustment to equity through accumulated other nonowner changes of $606 million ($956
million on a pretax basis) which increased the additional minimum pension liability. Equity market returns and interest rates
significantly impact the funded status of our pension plans. Based on future plan asset performance and interest rates, additional
adjustments to equity may be required.
Long-Lived Assets (including Tangible and Definite-Lived Intangible Assets)—To conduct our global business operations and
execute our business strategy, we acquire tangible and intangible assets. We periodically evaluate the recoverability of the carrying
amount of our long-lived assets (including property, plant and equipment and definite-lived intangible assets) whenever events or
changes in circumstances indicate that the carrying amount of a long-lived asset group may not be fully recoverable. These events or
changes in circumstances include business plans and forecasts, economic or competitive positions within an industry, as well as
current operating performance and anticipated future performance based on a business' competitive position. An impairment is
assessed when the undiscounted expected future cash flows derived from an asset are less than its carrying amount. Impairment losses
are measured as the amount by which the carrying value of a long-lived asset exceeds its fair value and are recognized in earnings. We
continually apply our best judgment
20