Honeywell 2004 Annual Report Download - page 44
Download and view the complete annual report
Please find page 44 of the 2004 Honeywell annual report below. You can navigate through the pages in the report by either clicking on the pages listed below, or by using the keyword search tool below to find specific information within the annual report.-
 1
1 -
2
-
3
-
4
-
5
-
6
-
7
-
8
-
9
-
10
-
11
-
12
-
13
-
14
-
15
-
16
-
17
-
18
-
19
-
20
-
21
-
22
-
23
-
24
-
25
-
26
-
27
-
28
-
29
-
30
-
31
-
32
-
33
-
 34
34 -
 35
35 -
 36
36 -
 37
37 -
 38
38 -
 39
39 -
 40
40 -
 41
41 -
 42
42 -
 43
43 -
 44
44 -
 45
45 -
 46
46 -
 47
47 -
 48
48 -
 49
49 -
 50
50 -
 51
51 -
 52
52 -
 53
53 -
 54
54 -
55
-
56
-
57
-
58
-
59
-
60
-
61
-
62
-
63
-
64
-
65
-
66
-
67
-
68
-
69
-
70
-
71
-
72
-
73
-
74
-
75
-
76
-
77
-
78
-
79
-
80
-
81
-
82
-
83
-
84
-
85
-
86
-
87
-
88
-
89
-
90
-
91
-
92
-
93
-
94
-
95
-
96
-
97
-
98
-
99
-
100
-
101
-
102
-
103
-
104
-
105
-
106
-
107
-
108
-
109
-
110
-
111
-
112
-
113
-
114
-
115
-
116
-
117
-
118
-
119
-
120
-
121
-
122
-
123
-
124
-
125
-
126
-
127
-
128
-
129
-
130
-
131
-
132
-
133
-
134
-
135
-
136
-
137
-
138
-
139
-
140
-
141
-
142
-
143
-
144
-
145
-
146
-
147
-
148
-
149
-
150
-
151
-
152
-
153
-
154
-
155
-
156
-
157
-
158
-
159
-
160
-
161
-
162
-
163
-
164
-
165
-
166
-
167
-
168
-
169
-
170
-
171
-
172
-
173
-
174
-
175
-
176
-
177
-
178
-
179
-
180
-
181
-
182
-
183
-
184
-
185
-
186
-
187
-
188
-
189
-
190
-
191
-
192
-
193
-
194
-
195
-
196
-
197
-
198
-
199
-
200
-
201
-
202
-
203
-
204
-
205
-
206
-
207
-
208
-
209
-
210
-
211
-
212
-
213
-
214
-
215
-
216
-
217
-
218
-
219
-
220
-
221
-
222
-
223
-
224
-
225
-
226
-
227
-
228
-
229
-
230
-
231
-
232
-
233
-
234
-
235
-
236
-
237
-
238
-
239
-
240
-
241
-
242
-
243
-
244
-
245
-
246
-
247
-
248
-
249
-
250
-
251
-
252
-
253
-
254
-
255
-
256
-
257
-
258
-
259
-
260
-
261
-
262
-
263
-
264
-
265
-
266
-
267
-
268
-
269
-
270
-
271
-
272
-
273
-
274
-
275
-
276
-
277
-
278
-
279
-
280
-
281
-
282
-
283
 |
 |

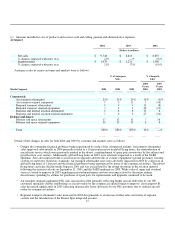
• Rate of increase in global diesel and gasoline turbocharger OEM demand arising from continued penetration of diesel
passenger cars into the European market, and North America truck shipments.
• The adoption of regulations aimed at reducing emissions.
• Change in consumer spending for automotive aftermarket products.
Repositioning and Other Charges
A summary of repositioning and other charges follows:
2004 2003 2002
(Dollars in millions)
Severance $ 85 $ 69 $ 270
Asset impairments 21 6 121
Exit costs 10 7 62
Reserve adjustments (28) (69) (76)
Total net repositioning charge 88 13 377
Asbestos related litigation charges, net of insurance 76 — 1,548
Other probable and reasonably estimable legal and
environmental liabilities 565 261 30
Business impairment charges 42 — 877
Customer claims and settlements of contract liabilities (10) — 152
Write-offs of receivables, inventories and other assets 14 2 60
Investment impairment charges — 2 15
Total net repositioning and other charges $ 775 $ 278 $ 3,059
The following table summarizes the pretax distribution of total net repositioning and other charges by income statement
classification:
2004 2003 2002
(Dollars in millions)
Cost of products and services sold $ 621 $ 272 $ 561
Selling, general and administrative expenses 25 4 45
Asbestos related litigation charges, net of insurance 76 — 1,548
Business impairment charges 42 — 877
Equity in (income) loss of affiliated companies 6 2 13
Other (income) expense 5 — 15
$ 775 $ 278 $ 3,059
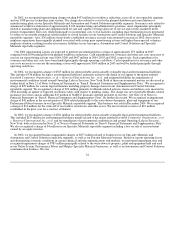
In 2004, we recognized repositioning charges totaling $116 million primarily for severance costs related to workforce reductions
of 2,272 manufacturing and administrative positions across all of our reportable segments. Also, $28 million of previously established
accruals, primarily for severance, were returned to income in 2004, due to fewer employee separations than originally planned
associated with certain prior repositioning actions, resulting in reduced severance liabilities principally in our Automation and Control
Solutions reportable segment.
In 2003, we recognized repositioning charges totaling $82 million primarly for severance costs related to workforce reductions of
1,501 manufacturing and administrative positions across all of our reportable segments. Also, $69 million of previously established
accruals, primarily for severance, were returned to income in 2003, due to fewer employee separations than originally planned
associated with certain prior repositioning actions, resulting in reduced severance liabilities in our Automation and Control Solutions,
Aerospace and Specialty Materials reportable segments.
31