Honeywell 2004 Annual Report Download - page 40
Download and view the complete annual report
Please find page 40 of the 2004 Honeywell annual report below. You can navigate through the pages in the report by either clicking on the pages listed below, or by using the keyword search tool below to find specific information within the annual report.-
 1
1 -
2
-
3
-
4
-
5
-
6
-
7
-
8
-
9
-
10
-
11
-
12
-
13
-
14
-
15
-
16
-
17
-
18
-
19
-
20
-
21
-
22
-
23
-
24
-
25
-
26
-
27
-
28
-
29
-
 30
30 -
 31
31 -
 32
32 -
 33
33 -
 34
34 -
 35
35 -
 36
36 -
 37
37 -
 38
38 -
 39
39 -
 40
40 -
 41
41 -
 42
42 -
 43
43 -
 44
44 -
 45
45 -
 46
46 -
 47
47 -
 48
48 -
 49
49 -
 50
50 -
51
-
52
-
53
-
54
-
55
-
56
-
57
-
58
-
59
-
60
-
61
-
62
-
63
-
64
-
65
-
66
-
67
-
68
-
69
-
70
-
71
-
72
-
73
-
74
-
75
-
76
-
77
-
78
-
79
-
80
-
81
-
82
-
83
-
84
-
85
-
86
-
87
-
88
-
89
-
90
-
91
-
92
-
93
-
94
-
95
-
96
-
97
-
98
-
99
-
100
-
101
-
102
-
103
-
104
-
105
-
106
-
107
-
108
-
109
-
110
-
111
-
112
-
113
-
114
-
115
-
116
-
117
-
118
-
119
-
120
-
121
-
122
-
123
-
124
-
125
-
126
-
127
-
128
-
129
-
130
-
131
-
132
-
133
-
134
-
135
-
136
-
137
-
138
-
139
-
140
-
141
-
142
-
143
-
144
-
145
-
146
-
147
-
148
-
149
-
150
-
151
-
152
-
153
-
154
-
155
-
156
-
157
-
158
-
159
-
160
-
161
-
162
-
163
-
164
-
165
-
166
-
167
-
168
-
169
-
170
-
171
-
172
-
173
-
174
-
175
-
176
-
177
-
178
-
179
-
180
-
181
-
182
-
183
-
184
-
185
-
186
-
187
-
188
-
189
-
190
-
191
-
192
-
193
-
194
-
195
-
196
-
197
-
198
-
199
-
200
-
201
-
202
-
203
-
204
-
205
-
206
-
207
-
208
-
209
-
210
-
211
-
212
-
213
-
214
-
215
-
216
-
217
-
218
-
219
-
220
-
221
-
222
-
223
-
224
-
225
-
226
-
227
-
228
-
229
-
230
-
231
-
232
-
233
-
234
-
235
-
236
-
237
-
238
-
239
-
240
-
241
-
242
-
243
-
244
-
245
-
246
-
247
-
248
-
249
-
250
-
251
-
252
-
253
-
254
-
255
-
256
-
257
-
258
-
259
-
260
-
261
-
262
-
263
-
264
-
265
-
266
-
267
-
268
-
269
-
270
-
271
-
272
-
273
-
274
-
275
-
276
-
277
-
278
-
279
-
280
-
281
-
282
-
283
 |
 |

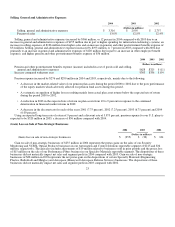
(1) Amounts included in cost of products and services sold and selling, general and administrative expenses.
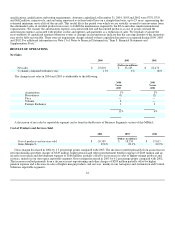
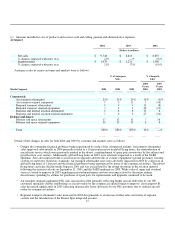
Aerospace
2004 2003 2002
(Dollars in millions)
Net sales $ 9,748 $ 8,813 $ 8,855
% change compared with prior year 11% —% (8)%
Segment profit $ 1,479 $ 1,221 $ 1,308
% change compared with prior year 21% (7)% (18)%
Aerospace sales by major customer end-markets were as follows:
% of Aerospace
Sales % Change in
Sales
Market Segment
2004
2003
2002
2004
Versus
2003
2003
Versus
2002
Commercial:
Air transport aftermarket 22% 21% 20% 19% (1)%
Air transport original equipment 9 9 11 5 (16)
Regional transport aftermarket 8 9 9 11 (8)
Regional transport original equipment 3 2 2 48 (15)
Business and general aviation aftermarket 8 8 8 13 6
Business and general aviation original equipment 7 6 8 27 (21)
Defense and Space:
Defense and space aftermarket 13 13 11 7 16
Defense and space original equipment 30 32 31 6 4
Total 100% 100% 100% 11% —%
Details of the changes in sales for both 2004 and 2003 by customer end-markets were as follows:
• Despite the continuing financial problems being experienced by many of the commercial airlines, air transport aftermarket
sales improved substantially in 2004 primarily related to a 10 percent increase in global flying hours, the reintroduction of
aircraft into service which were previously parked in the desert, a replenishment of spare parts inventories by the airlines and
growth in low cost carriers. Additionally, global flying hours in 2003 were adversely impacted as a result of the SARS
epidemic. Sales also improved due to an increase in upgrades and retrofits of avionics equipment (ground proximity warning
systems) to meet new regulatory standards. Air transport aftermarket sales were adversely impacted in 2003 by a decrease in
global flying hours of 1 percent and the financial problems being experienced by many of the commercial airlines. The global
flying hours and sales decline trends began in 2001 and was exacerbated by the abrupt downturn in the aviation industry
following the terrorists attacks on September 11, 2001 and the SARS epidemic in 2003. While sales of repair and overhaul
services started to improve in 2003 signaling increased maintenance and out-sourcing activity by the major airlines,
discretionary spending by airlines for purchases of spare parts for replacements and upgrades continued to be weak.
• Air transport original equipment (OE) sales increased in 2004 primarily reflecting higher aircraft deliveries by our OE
customers (primarily Airbus and Boeing) as aircraft orders by the commercial airlines began to improve. Air transport OE
sales decreased significantly in 2003 reflecting dramatically lower deliveries by our OE customers due to reduced aircraft
orders by commercial airlines.
• Regional transport aftermarket sales increased in 2004 due primarily to an increase in fleet sizes and routes of regional
carriers and the introduction of the Primus Epic integrated avionics
27