Honeywell 2004 Annual Report Download - page 35
Download and view the complete annual report
Please find page 35 of the 2004 Honeywell annual report below. You can navigate through the pages in the report by either clicking on the pages listed below, or by using the keyword search tool below to find specific information within the annual report.-
 1
1 -
2
-
3
-
4
-
5
-
6
-
7
-
8
-
9
-
10
-
11
-
12
-
13
-
14
-
15
-
16
-
17
-
18
-
19
-
20
-
21
-
22
-
23
-
24
-
 25
25 -
 26
26 -
 27
27 -
 28
28 -
 29
29 -
 30
30 -
 31
31 -
 32
32 -
 33
33 -
 34
34 -
 35
35 -
 36
36 -
 37
37 -
 38
38 -
 39
39 -
 40
40 -
 41
41 -
 42
42 -
 43
43 -
 44
44 -
 45
45 -
46
-
47
-
48
-
49
-
50
-
51
-
52
-
53
-
54
-
55
-
56
-
57
-
58
-
59
-
60
-
61
-
62
-
63
-
64
-
65
-
66
-
67
-
68
-
69
-
70
-
71
-
72
-
73
-
74
-
75
-
76
-
77
-
78
-
79
-
80
-
81
-
82
-
83
-
84
-
85
-
86
-
87
-
88
-
89
-
90
-
91
-
92
-
93
-
94
-
95
-
96
-
97
-
98
-
99
-
100
-
101
-
102
-
103
-
104
-
105
-
106
-
107
-
108
-
109
-
110
-
111
-
112
-
113
-
114
-
115
-
116
-
117
-
118
-
119
-
120
-
121
-
122
-
123
-
124
-
125
-
126
-
127
-
128
-
129
-
130
-
131
-
132
-
133
-
134
-
135
-
136
-
137
-
138
-
139
-
140
-
141
-
142
-
143
-
144
-
145
-
146
-
147
-
148
-
149
-
150
-
151
-
152
-
153
-
154
-
155
-
156
-
157
-
158
-
159
-
160
-
161
-
162
-
163
-
164
-
165
-
166
-
167
-
168
-
169
-
170
-
171
-
172
-
173
-
174
-
175
-
176
-
177
-
178
-
179
-
180
-
181
-
182
-
183
-
184
-
185
-
186
-
187
-
188
-
189
-
190
-
191
-
192
-
193
-
194
-
195
-
196
-
197
-
198
-
199
-
200
-
201
-
202
-
203
-
204
-
205
-
206
-
207
-
208
-
209
-
210
-
211
-
212
-
213
-
214
-
215
-
216
-
217
-
218
-
219
-
220
-
221
-
222
-
223
-
224
-
225
-
226
-
227
-
228
-
229
-
230
-
231
-
232
-
233
-
234
-
235
-
236
-
237
-
238
-
239
-
240
-
241
-
242
-
243
-
244
-
245
-
246
-
247
-
248
-
249
-
250
-
251
-
252
-
253
-
254
-
255
-
256
-
257
-
258
-
259
-
260
-
261
-
262
-
263
-
264
-
265
-
266
-
267
-
268
-
269
-
270
-
271
-
272
-
273
-
274
-
275
-
276
-
277
-
278
-
279
-
280
-
281
-
282
-
283
 |
 |

specifications, qualification and testing requirements. Amounts capitalized at December 31, 2004, 2003 and 2002 were $776, $719
and $662 million, respectively, and are being amortized over their useful lives on a straight-line basis, up to 25 years, representing the
estimated minimum service life of the aircraft. This useful life is the period over which we are virtually assured to earn revenues from
the aftermarket sales of certified products necessary to fulfill the maintenance required by the FAA and other similar international
organizations. We classify the amortization expense associated with free and discounted products as cost of goods sold and the
amortization expense associated with product credits and upfront cash payments as a reduction of sales. We regularly evaluate the
recoverablitity of capitalized amounts whenever events or changes in circumstances indicate that the carrying amount of the incentives
may not be fully recoverable. There were no impairment charges related to these capitalized incentives recognized during 2004, 2003
and 2002. For additional information see Note 13 of Notes to Financial Statements in “Item 8. Financial Statements and
Supplementary Data.”
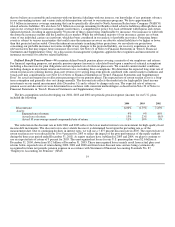
RESULTS OF OPERATIONS
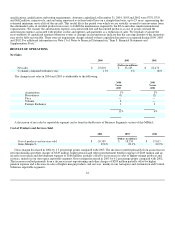
Net Sales
2004 2003 2002
(Dollars in millions)
Net sales $ 25,601 $ 23,103 $ 22,274
% change compared with prior year 11% 4% (6)%
The change in net sales in 2004 and 2003 is attributable to the following:
2004
Versus
2003
2003
Versus
2002
Acquisitions 1% 3%
Divestitures (1) (2)
Price — —
Volume 8 —
Foreign Exchange 3 3
11% 4%
A discussion of net sales by reportable segment can be found in the Review of Business Segments section of this MD&A.
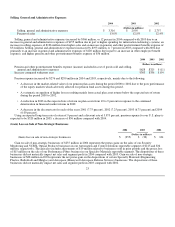
Cost of Products and Services Sold
2004 2003 2002
(Dollars in millions)
Cost of products and services sold $ 20,585 $ 18,235 $ 17,615
Gross Margin % 19.6% 21.1% 20.9%
Gross margin decreased in 2004 by 1.5 percentage points compared with 2003. The decrease resulted primarily from an increase in
net repositioning and other charges of $349 million, higher pension and other postretirement benefits expense of $249 million and an
increase in research and development expense of $166 million, partially offset by an increase in sales of higher-margin products and
services, mainly in our Aerospace reportable segment. Gross margin increased in 2003 by 0.2 percentage points compared with 2002.
The increase resulted primarily from a decrease in net repositioning and other charges of $289 million partially offset by higher
pension expense and a decrease in sales of higher-margin products and services, mainly in our Aerospace and Automation and Control
Solutions reportable segments.
22