Honeywell 2004 Annual Report Download - page 37
Download and view the complete annual report
Please find page 37 of the 2004 Honeywell annual report below. You can navigate through the pages in the report by either clicking on the pages listed below, or by using the keyword search tool below to find specific information within the annual report.-
 1
1 -
2
-
3
-
4
-
5
-
6
-
7
-
8
-
9
-
10
-
11
-
12
-
13
-
14
-
15
-
16
-
17
-
18
-
19
-
20
-
21
-
22
-
23
-
24
-
25
-
26
-
 27
27 -
 28
28 -
 29
29 -
 30
30 -
 31
31 -
 32
32 -
 33
33 -
 34
34 -
 35
35 -
 36
36 -
 37
37 -
 38
38 -
 39
39 -
 40
40 -
 41
41 -
 42
42 -
 43
43 -
 44
44 -
 45
45 -
 46
46 -
 47
47 -
48
-
49
-
50
-
51
-
52
-
53
-
54
-
55
-
56
-
57
-
58
-
59
-
60
-
61
-
62
-
63
-
64
-
65
-
66
-
67
-
68
-
69
-
70
-
71
-
72
-
73
-
74
-
75
-
76
-
77
-
78
-
79
-
80
-
81
-
82
-
83
-
84
-
85
-
86
-
87
-
88
-
89
-
90
-
91
-
92
-
93
-
94
-
95
-
96
-
97
-
98
-
99
-
100
-
101
-
102
-
103
-
104
-
105
-
106
-
107
-
108
-
109
-
110
-
111
-
112
-
113
-
114
-
115
-
116
-
117
-
118
-
119
-
120
-
121
-
122
-
123
-
124
-
125
-
126
-
127
-
128
-
129
-
130
-
131
-
132
-
133
-
134
-
135
-
136
-
137
-
138
-
139
-
140
-
141
-
142
-
143
-
144
-
145
-
146
-
147
-
148
-
149
-
150
-
151
-
152
-
153
-
154
-
155
-
156
-
157
-
158
-
159
-
160
-
161
-
162
-
163
-
164
-
165
-
166
-
167
-
168
-
169
-
170
-
171
-
172
-
173
-
174
-
175
-
176
-
177
-
178
-
179
-
180
-
181
-
182
-
183
-
184
-
185
-
186
-
187
-
188
-
189
-
190
-
191
-
192
-
193
-
194
-
195
-
196
-
197
-
198
-
199
-
200
-
201
-
202
-
203
-
204
-
205
-
206
-
207
-
208
-
209
-
210
-
211
-
212
-
213
-
214
-
215
-
216
-
217
-
218
-
219
-
220
-
221
-
222
-
223
-
224
-
225
-
226
-
227
-
228
-
229
-
230
-
231
-
232
-
233
-
234
-
235
-
236
-
237
-
238
-
239
-
240
-
241
-
242
-
243
-
244
-
245
-
246
-
247
-
248
-
249
-
250
-
251
-
252
-
253
-
254
-
255
-
256
-
257
-
258
-
259
-
260
-
261
-
262
-
263
-
264
-
265
-
266
-
267
-
268
-
269
-
270
-
271
-
272
-
273
-
274
-
275
-
276
-
277
-
278
-
279
-
280
-
281
-
282
-
283
 |
 |

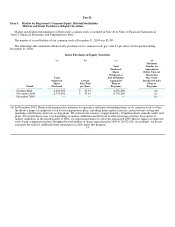
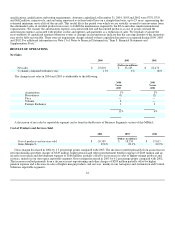
Asbestos Related Litigation Charges, Net of Insurance
2004 2003 2002
(Dollars in millions)
Asbestos related litigation charges, net of insurance $ 76 $ — $ 1,548
In 2004, we recognized charges totaling $76 million primarily for Bendix related asbestos claims filed and defense costs incurred
during 2004, net of insurance recoveries. The charges include an update of expected resolution values for pending Bendix claims and
are net of an additional $47 million of NARCO insurance deemed probable of recovery. In 2002, asbestos related litigation charges,
net of insurance related to costs associated with asbestos claims related to NARCO. See Asbestos Matters in Note 21 of Notes to
Financial Statements in “Item 8. Financial Statements and Supplementary Data” for further discussion.
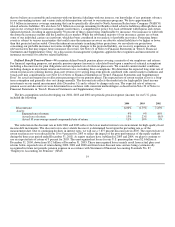
Business Impairment Charges
2004 2003 2002
(Dollars in millions)
Business impairment charges $ 42 $ — $ 877
Business impairment charges in 2004 relates principally to the write-down of property, plant and equipment of our Performance
Fibers business in our Specialty Materials reportable segment. The Performance Fibers business was sold in the fourth quarter of
2004. Business impairment charges in 2002 related to the write-down of property, plant and equipment of businesses in our Specialty
Materials and Automation and Control Solutions reportable segments and of our Friction Materials business. See the repositioning and
other charges section of this MD&A for further details.
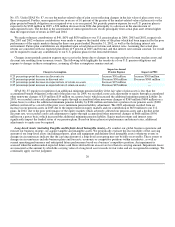
Equity in (Income) Loss of Affiliated Companies
2004 2003 2002
(Dollars in millions)
Equity in (income) loss of affiliated companies $ (82) $ (38) $ (42)
Equity income increased by $44 million in 2004 compared with 2003 due primarily to an improvement in earnings from our UOP
process technology joint venture (UOP). Equity income decreased by $4 million in 2003 compared with 2002 due to a charge of $2
million in 2003 related to the sale of a Specialty Materials' equity investee's investment. Also, 2002 included income of $15 million
resulting from exiting joint ventures in our Aerospace and Transportation Systems reportable segments partially offset by a charge of
$13 million for severance actions by UOP.
Other (Income) Expense
2004 2003 2002
(Dollars in millions)
Other (income) expense $ (92) $ 19 $ (4)
Other income increased by $111 million in 2004 compared with 2003 due principally to a decrease in foreign exchange losses of
$93 million in the current year due to a reduction in foreign exchange exposures resulting in losses in 2003 due to a weak U.S. dollar,
a gain of $27 million related to the settlement of a patent infringement lawsuit and an increase in interest income of $13 million from
higher cash balances, partially offset by the inclusion of a gain of $20 million in the prior year related to the settlement of a patent
infringement lawsuit. Other expense increased by $23 million in 2003 compared with 2002 due principally to an increase of $65
million in foreign exchange losses resulting from weakness in the U.S. dollar mainly against the EURO partially offset by a gain of
$20 million related to a settlement of a patent infringement lawsuit and an increase of $19 million in interest income from higher cash
balances.
24