Honeywell 2004 Annual Report Download - page 52
Download and view the complete annual report
Please find page 52 of the 2004 Honeywell annual report below. You can navigate through the pages in the report by either clicking on the pages listed below, or by using the keyword search tool below to find specific information within the annual report.-
 1
1 -
2
-
3
-
4
-
5
-
6
-
7
-
8
-
9
-
10
-
11
-
12
-
13
-
14
-
15
-
16
-
17
-
18
-
19
-
20
-
21
-
22
-
23
-
24
-
25
-
26
-
27
-
28
-
29
-
30
-
31
-
32
-
33
-
34
-
35
-
36
-
37
-
38
-
39
-
40
-
41
-
 42
42 -
 43
43 -
 44
44 -
 45
45 -
 46
46 -
 47
47 -
 48
48 -
 49
49 -
 50
50 -
 51
51 -
 52
52 -
 53
53 -
 54
54 -
 55
55 -
 56
56 -
 57
57 -
 58
58 -
 59
59 -
 60
60 -
 61
61 -
 62
62 -
63
-
64
-
65
-
66
-
67
-
68
-
69
-
70
-
71
-
72
-
73
-
74
-
75
-
76
-
77
-
78
-
79
-
80
-
81
-
82
-
83
-
84
-
85
-
86
-
87
-
88
-
89
-
90
-
91
-
92
-
93
-
94
-
95
-
96
-
97
-
98
-
99
-
100
-
101
-
102
-
103
-
104
-
105
-
106
-
107
-
108
-
109
-
110
-
111
-
112
-
113
-
114
-
115
-
116
-
117
-
118
-
119
-
120
-
121
-
122
-
123
-
124
-
125
-
126
-
127
-
128
-
129
-
130
-
131
-
132
-
133
-
134
-
135
-
136
-
137
-
138
-
139
-
140
-
141
-
142
-
143
-
144
-
145
-
146
-
147
-
148
-
149
-
150
-
151
-
152
-
153
-
154
-
155
-
156
-
157
-
158
-
159
-
160
-
161
-
162
-
163
-
164
-
165
-
166
-
167
-
168
-
169
-
170
-
171
-
172
-
173
-
174
-
175
-
176
-
177
-
178
-
179
-
180
-
181
-
182
-
183
-
184
-
185
-
186
-
187
-
188
-
189
-
190
-
191
-
192
-
193
-
194
-
195
-
196
-
197
-
198
-
199
-
200
-
201
-
202
-
203
-
204
-
205
-
206
-
207
-
208
-
209
-
210
-
211
-
212
-
213
-
214
-
215
-
216
-
217
-
218
-
219
-
220
-
221
-
222
-
223
-
224
-
225
-
226
-
227
-
228
-
229
-
230
-
231
-
232
-
233
-
234
-
235
-
236
-
237
-
238
-
239
-
240
-
241
-
242
-
243
-
244
-
245
-
246
-
247
-
248
-
249
-
250
-
251
-
252
-
253
-
254
-
255
-
256
-
257
-
258
-
259
-
260
-
261
-
262
-
263
-
264
-
265
-
266
-
267
-
268
-
269
-
270
-
271
-
272
-
273
-
274
-
275
-
276
-
277
-
278
-
279
-
280
-
281
-
282
-
283
 |
 |

replacement, production capacity expansion, cost reduction and growth. There are $956 million of long-term debt repayments
scheduled for 2005. Assuming that actual pension plan returns are consistent with our expected rate of return of 9 percent in 2005 and
beyond and that interest rates remain constant, we would not be required to make any contributions to our U.S. pension plans for the
foreseeable future. Due to share repurchases made in the fourth quarter of 2004 to offset the anticipated 2005 dilutive impact of
employee stock-based compensation plans, we do not anticipate the need for additional share repurchases in 2005 under the program
initiated in the fourth quarter of 2003. Total repurchases may vary depending on market conditions and the level of other investing
activities. Cash expenditures for severance and other exit costs necessary to execute the remaining repositioning actions will
approximate $100 million in 2005. We expect our cash expenditures for asbestos claims in 2005 to be approximately $744 million and
insurance recoveries to be approximately $150 million in 2005. See Asbestos Matters in Note 21 of Notes to Financial Statements in
“Item 8. Financial Statements and Supplementary Data” for further discussion. As discussed in Note 2 of Notes to Financial
Statements in “Item 8. Financial Statements and Supplementary Data,” we expect to complete our acquisition of Novar plc in the first
quarter of 2005. We expect to fund the acquisition with existing cash resources.
We continuously assess the relative strength of each business in our portfolio as to strategic fit, market position, profit and cash
flow contribution in order to upgrade our combined portfolio and identify business units that will most benefit from increased
investment. We identify acquisition candidates that will further our strategic plan and strengthen our existing core businesses. We also
identify business units that do not fit into our long-term strategic plan based on their market position, relative profitability or growth
potential. These business units are considered for potential divestiture, restructuring or other repositioning actions subject to regulatory
constraints. In 2004, we realized $426 million in cash proceeds from sales of non-strategic businesses.
We believe that our operating cash flows will be sufficient to meet our future cash needs. Our available cash, committed credit
lines, access to the public debt and equity markets using debt and equity securities, including commercial paper, as well as our ability
to sell trade accounts receivables, provide additional sources of short-term and long-term liquidity to fund current operations and
future investment opportunities. Based on our current financial position and expected economic performance, we do not believe that
our liquidity will be adversely impacted by an inability to access our sources of financing.
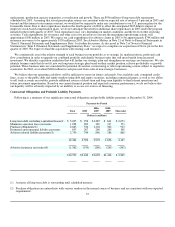
Contractual Obligations and Probable Liability Payments
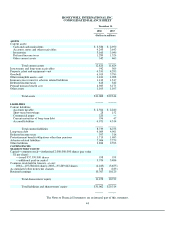
Following is a summary of our significant contractual obligations and probable liability payments at December 31, 2004:
Payments by Period
Total 2005 2006-
2007 2008-
2009 Thereafter
(Dollars in millions)
Long-term debt, including capitalized leases(1) $ 5,025 $ 956 $1,385 $ 611 $ 2,073
Minimum operating lease payments 1,028 289 369 197 173
Purchase obligations(2) 2,663 334 1,104 302 923
Estimated environmental liability payments 895 267 260 260 108
Asbestos related liability payments(3) 2,750 744 860 286 860
12,361 2,590 3,978 1,656 4,137
Asbestos insurance recoveries(4) (1,562) (150) (280) (240) (892)
$10,799 $2,440 $3,698 $1,416 $ 3,245
(1) Assumes all long-term debt is outstanding until scheduled maturity.
(2) Purchase obligations are entered into with various vendors in the normal course of business and are consistent with our expected
requirements. 37