Honeywell 2004 Annual Report Download - page 29
Download and view the complete annual report
Please find page 29 of the 2004 Honeywell annual report below. You can navigate through the pages in the report by either clicking on the pages listed below, or by using the keyword search tool below to find specific information within the annual report.-
 1
1 -
2
-
3
-
4
-
5
-
6
-
7
-
8
-
9
-
10
-
11
-
12
-
13
-
14
-
15
-
16
-
17
-
18
-
 19
19 -
 20
20 -
 21
21 -
 22
22 -
 23
23 -
 24
24 -
 25
25 -
 26
26 -
 27
27 -
 28
28 -
 29
29 -
 30
30 -
 31
31 -
 32
32 -
 33
33 -
 34
34 -
 35
35 -
 36
36 -
 37
37 -
 38
38 -
 39
39 -
40
-
41
-
42
-
43
-
44
-
45
-
46
-
47
-
48
-
49
-
50
-
51
-
52
-
53
-
54
-
55
-
56
-
57
-
58
-
59
-
60
-
61
-
62
-
63
-
64
-
65
-
66
-
67
-
68
-
69
-
70
-
71
-
72
-
73
-
74
-
75
-
76
-
77
-
78
-
79
-
80
-
81
-
82
-
83
-
84
-
85
-
86
-
87
-
88
-
89
-
90
-
91
-
92
-
93
-
94
-
95
-
96
-
97
-
98
-
99
-
100
-
101
-
102
-
103
-
104
-
105
-
106
-
107
-
108
-
109
-
110
-
111
-
112
-
113
-
114
-
115
-
116
-
117
-
118
-
119
-
120
-
121
-
122
-
123
-
124
-
125
-
126
-
127
-
128
-
129
-
130
-
131
-
132
-
133
-
134
-
135
-
136
-
137
-
138
-
139
-
140
-
141
-
142
-
143
-
144
-
145
-
146
-
147
-
148
-
149
-
150
-
151
-
152
-
153
-
154
-
155
-
156
-
157
-
158
-
159
-
160
-
161
-
162
-
163
-
164
-
165
-
166
-
167
-
168
-
169
-
170
-
171
-
172
-
173
-
174
-
175
-
176
-
177
-
178
-
179
-
180
-
181
-
182
-
183
-
184
-
185
-
186
-
187
-
188
-
189
-
190
-
191
-
192
-
193
-
194
-
195
-
196
-
197
-
198
-
199
-
200
-
201
-
202
-
203
-
204
-
205
-
206
-
207
-
208
-
209
-
210
-
211
-
212
-
213
-
214
-
215
-
216
-
217
-
218
-
219
-
220
-
221
-
222
-
223
-
224
-
225
-
226
-
227
-
228
-
229
-
230
-
231
-
232
-
233
-
234
-
235
-
236
-
237
-
238
-
239
-
240
-
241
-
242
-
243
-
244
-
245
-
246
-
247
-
248
-
249
-
250
-
251
-
252
-
253
-
254
-
255
-
256
-
257
-
258
-
259
-
260
-
261
-
262
-
263
-
264
-
265
-
266
-
267
-
268
-
269
-
270
-
271
-
272
-
273
-
274
-
275
-
276
-
277
-
278
-
279
-
280
-
281
-
282
-
283
 |
 |

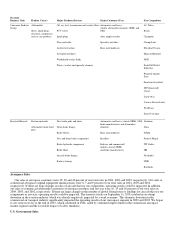
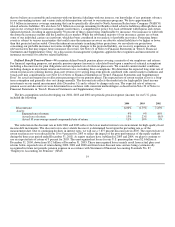
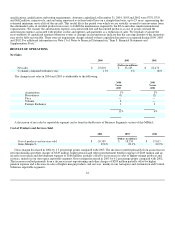
Aerospace
2004 2003 2002
(Dollars in millions)
Net sales $ 9,748 $ 8,813 $ 8,855
Segment profit $ 1,479 $ 1,221 $ 1,308
Segment profit % 15.2% 13.9% 14.8%
Aerospace is a leading global supplier of aircraft engines, avionics, and related products and services for commercial airlines,
business and regional aircraft, manned and unmanned military aircraft, and spacecraft. Our Aerospace portfolio includes Engines,
Systems and Services (auxiliary power units; propulsion engines; environmental control systems; engine controls; repair and overhaul
services; hardware; logistics; and electric power systems); Aerospace Electronic Systems (flight safety, communications, navigation,
radar and surveillance systems; aircraft and airport lighting; management and technical services and advanced systems and
instruments); and Aircraft Landing Systems (aircraft wheels and brakes). Aerospace sells its products to original equipment (OE)
manufacturers in the commercial air transport and business and regional aircraft segments, as well as spare parts into the aftermarket
(principally to aircraft operators). The United States Government is also a major customer for our defense and space products.
Economic and Other Factors—Aerospace's operating results are principally driven by the global demand for air travel as
reflected in new aircraft production, as well as spare parts and maintenance and repair services for aircraft currently in use. Aircraft
production by commercial air transport OE manufacturers, business and regional jet deliveries, as well as global flying hours and
airline profitability, are the principal factors that drive our commercial aerospace operating results. U.S. Government appropriations
for defense and space programs and military activity are critical factors impacting our defense and space operating results.
Business Challenges/Areas of Focus—Aerospace's primary business challenges and areas of focus include:
• Continuing to grow the sales and profitability of the commercial aerospace aftermarket as the worldwide airline industry
struggles to regain and maintain profitable operations.
• Securing Honeywell product content on new aircraft platforms.
• Making our product development process faster and less costly to meet increasing customer requirements while continuing to
reduce recurring manufacturing costs.
• Continuing to design equipment that enhances the safety, performance and durability of aircraft, while reducing weight and
operating costs.
• Utilizing our systems engineering expertise for continued growth in Network Centric Warfare initiatives with the U.S.
Government.
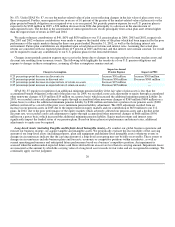
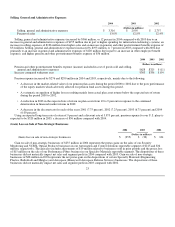
Automation and Control Solutions (ACS)
2004 2003 2002
(Dollars in millions)
Net sales $ 8,031 $ 7,464 $ 6,978
Segment profit $ 894 $ 843 $ 860
Segment profit % 11.1% 11.3% 12.3%
ACS provides innovative solutions that make homes, buildings, industrial sites and airport facilities more efficient, safe and
comfortable. Our ACS portfolio includes Automation and Control Products (controls for heating, cooling, indoor air quality,
ventilation, humidification and home automation; advanced software applications for home/building control and optimization; sensors,
switches, control systems and instruments for measuring pressure, air flow, temperature, electrical current; and security and fire
detection, access control, video surveillance and remote patient monitoring systems); Building Solutions (installs, maintains and
upgrades systems that keep buildings safe, comfortable and productive); and Process Solutions (provides a full range of automation
and control solutions for
16