Honeywell 2004 Annual Report Download - page 39
Download and view the complete annual report
Please find page 39 of the 2004 Honeywell annual report below. You can navigate through the pages in the report by either clicking on the pages listed below, or by using the keyword search tool below to find specific information within the annual report.-
 1
1 -
2
-
3
-
4
-
5
-
6
-
7
-
8
-
9
-
10
-
11
-
12
-
13
-
14
-
15
-
16
-
17
-
18
-
19
-
20
-
21
-
22
-
23
-
24
-
25
-
26
-
27
-
28
-
 29
29 -
 30
30 -
 31
31 -
 32
32 -
 33
33 -
 34
34 -
 35
35 -
 36
36 -
 37
37 -
 38
38 -
 39
39 -
 40
40 -
 41
41 -
 42
42 -
 43
43 -
 44
44 -
 45
45 -
 46
46 -
 47
47 -
 48
48 -
 49
49 -
50
-
51
-
52
-
53
-
54
-
55
-
56
-
57
-
58
-
59
-
60
-
61
-
62
-
63
-
64
-
65
-
66
-
67
-
68
-
69
-
70
-
71
-
72
-
73
-
74
-
75
-
76
-
77
-
78
-
79
-
80
-
81
-
82
-
83
-
84
-
85
-
86
-
87
-
88
-
89
-
90
-
91
-
92
-
93
-
94
-
95
-
96
-
97
-
98
-
99
-
100
-
101
-
102
-
103
-
104
-
105
-
106
-
107
-
108
-
109
-
110
-
111
-
112
-
113
-
114
-
115
-
116
-
117
-
118
-
119
-
120
-
121
-
122
-
123
-
124
-
125
-
126
-
127
-
128
-
129
-
130
-
131
-
132
-
133
-
134
-
135
-
136
-
137
-
138
-
139
-
140
-
141
-
142
-
143
-
144
-
145
-
146
-
147
-
148
-
149
-
150
-
151
-
152
-
153
-
154
-
155
-
156
-
157
-
158
-
159
-
160
-
161
-
162
-
163
-
164
-
165
-
166
-
167
-
168
-
169
-
170
-
171
-
172
-
173
-
174
-
175
-
176
-
177
-
178
-
179
-
180
-
181
-
182
-
183
-
184
-
185
-
186
-
187
-
188
-
189
-
190
-
191
-
192
-
193
-
194
-
195
-
196
-
197
-
198
-
199
-
200
-
201
-
202
-
203
-
204
-
205
-
206
-
207
-
208
-
209
-
210
-
211
-
212
-
213
-
214
-
215
-
216
-
217
-
218
-
219
-
220
-
221
-
222
-
223
-
224
-
225
-
226
-
227
-
228
-
229
-
230
-
231
-
232
-
233
-
234
-
235
-
236
-
237
-
238
-
239
-
240
-
241
-
242
-
243
-
244
-
245
-
246
-
247
-
248
-
249
-
250
-
251
-
252
-
253
-
254
-
255
-
256
-
257
-
258
-
259
-
260
-
261
-
262
-
263
-
264
-
265
-
266
-
267
-
268
-
269
-
270
-
271
-
272
-
273
-
274
-
275
-
276
-
277
-
278
-
279
-
280
-
281
-
282
-
283
 |
 |

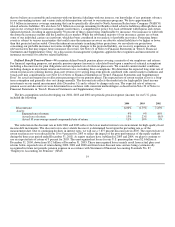
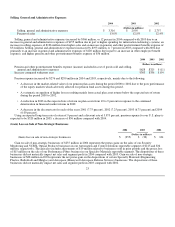
Net Income (Loss)
2004 2003 2002
(Dollars in millions,
except per share amounts)
Net income (loss) $ 1,281 $ 1,324 $ (220)
Earnings (loss) per share of common stock—assuming dilution $ 1.49 $ 1.54 $ (0.27)
The decrease of $0.05 per share in 2004 compared with 2003 relates primarily to increased charges for environmental matters
primarily attributable to the denial of our appeal in the matter entitled Interfaith Community Organization et. al. v. Honeywell
International Inc. et. al. (See Note 21 of Notes to Financial Statements in “Item 8. Financial Statements and Supplementary Data”)
and higher pension and other postretirement benefits expense, partially offset by an increase in segment profit across all reportable
segments. The increase of $1.81 per share in 2003 compared with 2002 mainly relates to a decrease in repositioning and other charges
partially offset by the impact of higher pension expense and lower sales of higher-margin products and services, principally in our
Aerospace and Automation and Control Solutions reportable segments.
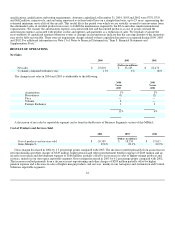
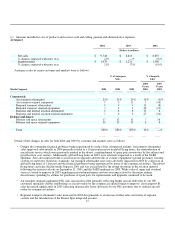
Review of Business Segments
2004 2003 2002
(Dollars in millions)
Net Sales
Aerospace $ 9,748 $ 8,813 $ 8,855
Automation and Control Solutions 8,031 7,464 6,978
Specialty Materials 3,497 3,169 3,205
Transportation Systems 4,323 3,650 3,184
Corporate 2 7 52
$ 25,601 $ 23,103 $ 22,274
Segment Profit
Aerospace $ 1,479 $ 1,221 $ 1,308
Automation and Control Solutions 894 843 860
Specialty Materials 184 136 90
Transportation Systems 575 461 393
Corporate (158) (142) (154)
$ 2,974 $ 2,519 $ 2,497
A reconciliation of segment profit to income (loss) before taxes and cumulative effect of accounting change follows:
2004 2003 2002
(Dollars in millions)
Segment profit $ 2,974 $ 2,519 $ 2,497
Gain (loss) on sale of non-strategic businesses 255 38 (124)
Asbestos related litigation charges, net of insurance (76) — (1,548)
Business impairment charges (42) — (877)
Repositioning and other charges(1) (646) (276) (606)
Pension and other postretirement benefits (expense) income(1) (628) (325) 11
Equity in income (loss) of affiliated companies 82 38 42
Other income (expense) 92 (19) 4
Interest and other financial charges (331) (335) (344)
Income (loss) before taxes and cumulative effect of accounting change $ 1,680 $ 1,640 $ (945)
26