Honeywell 2004 Annual Report Download - page 42
Download and view the complete annual report
Please find page 42 of the 2004 Honeywell annual report below. You can navigate through the pages in the report by either clicking on the pages listed below, or by using the keyword search tool below to find specific information within the annual report.-
 1
1 -
2
-
3
-
4
-
5
-
6
-
7
-
8
-
9
-
10
-
11
-
12
-
13
-
14
-
15
-
16
-
17
-
18
-
19
-
20
-
21
-
22
-
23
-
24
-
25
-
26
-
27
-
28
-
29
-
30
-
31
-
 32
32 -
 33
33 -
 34
34 -
 35
35 -
 36
36 -
 37
37 -
 38
38 -
 39
39 -
 40
40 -
 41
41 -
 42
42 -
 43
43 -
 44
44 -
 45
45 -
 46
46 -
 47
47 -
 48
48 -
 49
49 -
 50
50 -
 51
51 -
 52
52 -
53
-
54
-
55
-
56
-
57
-
58
-
59
-
60
-
61
-
62
-
63
-
64
-
65
-
66
-
67
-
68
-
69
-
70
-
71
-
72
-
73
-
74
-
75
-
76
-
77
-
78
-
79
-
80
-
81
-
82
-
83
-
84
-
85
-
86
-
87
-
88
-
89
-
90
-
91
-
92
-
93
-
94
-
95
-
96
-
97
-
98
-
99
-
100
-
101
-
102
-
103
-
104
-
105
-
106
-
107
-
108
-
109
-
110
-
111
-
112
-
113
-
114
-
115
-
116
-
117
-
118
-
119
-
120
-
121
-
122
-
123
-
124
-
125
-
126
-
127
-
128
-
129
-
130
-
131
-
132
-
133
-
134
-
135
-
136
-
137
-
138
-
139
-
140
-
141
-
142
-
143
-
144
-
145
-
146
-
147
-
148
-
149
-
150
-
151
-
152
-
153
-
154
-
155
-
156
-
157
-
158
-
159
-
160
-
161
-
162
-
163
-
164
-
165
-
166
-
167
-
168
-
169
-
170
-
171
-
172
-
173
-
174
-
175
-
176
-
177
-
178
-
179
-
180
-
181
-
182
-
183
-
184
-
185
-
186
-
187
-
188
-
189
-
190
-
191
-
192
-
193
-
194
-
195
-
196
-
197
-
198
-
199
-
200
-
201
-
202
-
203
-
204
-
205
-
206
-
207
-
208
-
209
-
210
-
211
-
212
-
213
-
214
-
215
-
216
-
217
-
218
-
219
-
220
-
221
-
222
-
223
-
224
-
225
-
226
-
227
-
228
-
229
-
230
-
231
-
232
-
233
-
234
-
235
-
236
-
237
-
238
-
239
-
240
-
241
-
242
-
243
-
244
-
245
-
246
-
247
-
248
-
249
-
250
-
251
-
252
-
253
-
254
-
255
-
256
-
257
-
258
-
259
-
260
-
261
-
262
-
263
-
264
-
265
-
266
-
267
-
268
-
269
-
270
-
271
-
272
-
273
-
274
-
275
-
276
-
277
-
278
-
279
-
280
-
281
-
282
-
283
 |
 |

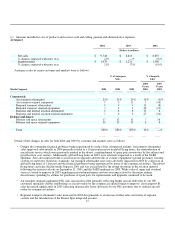
Monitoring business. Automation and Control Solutions sales in 2003 increased by 7 percent compared with 2002 due to favorable
effects of foreign exchange of 5 percent and acquisitions, net of the disposition of our Consumer Products business, of 4 percent,
partially offset by the impact of lower prices and volumes of 1 percent each. Sales increased by 11 percent for our Automation and
Control Products businesses as the favorable effects of foreign exchange and acquisitions, mainly Invensys Sensor Systems
(Invensys), more than offset the impact of the disposition of our Consumer Products business and lower volumes. Sales for our
Process Solutions business increased by 4 percent due to the favorable effect of foreign exchange partially offset by lower unit
volumes. Sales for our Building Solutions business increased by 2 percent as the favorable effect of foreign exchange more than offset
lower volumes due to continued softness in the non-residential construction market.
Automation and Control Solutions segment profit in 2004 increased by 6 percent compared with 2003 due to the favorable effect
of higher sales volumes partially offset by increased investments in sales and marketing initiatives and higher research and
development costs to support new product introductions. Automation and Control Solutions segment profit in 2003 decreased by 2
percent compared with 2002 due mainly to the decline in higher-margin energy-retrofit and discretionary spot sales in our Building
Solutions business, and increased research and development expense and investments in sales and marketing initiatives, mainly in our
Automation and Control Products and Building Solutions businesses, respectively. Segment profit was also adversely impacted in
2003 by pricing pressures mainly in our Automation and Control Products and Process Solutions businesses.
Trends which may impact Automation and Control Solutions operating results in 2005 include:
• Extent, if any, of recovery in non-residential construction spending and capital spending on building and process automation.
• Consolidation in the fire and security industry may result in increased competition.
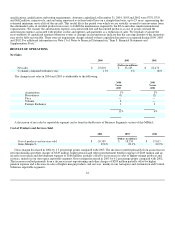
Specialty Materials
2004 2003 2002
(Dollars in millions)
Net sales $ 3,497 $ 3,169 $ 3,205
% change compared with prior year 10% (1)% (3)%
Segment profit $ 184 $ 136 $ 90
% change compared with prior year 35% 51% 61%
Specialty Materials sales in 2004 increased by 10 percent compared with 2003 due to the impact of higher prices of 6 percent
(mainly in our Nylon System business), higher volumes of 5 percent and the favorable effect of foreign exchange of 1 percent,
partially offset by prior year divestitures, net of acquisitions, of 2 percent. Sales for our Chemicals business improved by 19 percent
driven principally by continuing strong demand for our non-ozone depleting HFC products for refrigeration and air conditioning
applications, as well as for blowing agents for insulation applications. Sales for our Electronic Materials business increased by 13
percent driven by improvement in the semiconductor industry. Sales for our Performance Products business were also higher by 13
percent due to strong demand for our Spectra fiber, principally from the U.S. military. Specialty Materials sales in 2003 decreased by
1 percent compared with 2002 due to the impact of the divestitures of our Advanced Circuits, PFC and Engineering Plastics
businesses, net of the acquisition of BASF's nylon fiber business, of 6 percent partially offset by the favorable effects of foreign
exchange of 3 percent and higher volumes of 2 percent. Higher volumes were principally driven by strong demand for Spectra fiber
from the U.S. military, increasing demand for HFCs, a key component of many non-ozone depleting refrigerants and foam blowing
agents and increased demand for electronic materials from the semiconductor industry. Volumes were adversely affected in 2003 by
the temporary plant shutdowns in our Fluorocarbons and Nylon System businesses.
Specialty Materials segment profit in 2004 increased by 35 percent compared with 2003 due principally to higher sales volumes
and price increases, partially offset by higher raw material costs (principally phenol resulting from increases in benzene prices) mainly
in our Nylon System business.
29