Honeywell 2004 Annual Report Download - page 36
Download and view the complete annual report
Please find page 36 of the 2004 Honeywell annual report below. You can navigate through the pages in the report by either clicking on the pages listed below, or by using the keyword search tool below to find specific information within the annual report.-
 1
1 -
2
-
3
-
4
-
5
-
6
-
7
-
8
-
9
-
10
-
11
-
12
-
13
-
14
-
15
-
16
-
17
-
18
-
19
-
20
-
21
-
22
-
23
-
24
-
25
-
 26
26 -
 27
27 -
 28
28 -
 29
29 -
 30
30 -
 31
31 -
 32
32 -
 33
33 -
 34
34 -
 35
35 -
 36
36 -
 37
37 -
 38
38 -
 39
39 -
 40
40 -
 41
41 -
 42
42 -
 43
43 -
 44
44 -
 45
45 -
 46
46 -
47
-
48
-
49
-
50
-
51
-
52
-
53
-
54
-
55
-
56
-
57
-
58
-
59
-
60
-
61
-
62
-
63
-
64
-
65
-
66
-
67
-
68
-
69
-
70
-
71
-
72
-
73
-
74
-
75
-
76
-
77
-
78
-
79
-
80
-
81
-
82
-
83
-
84
-
85
-
86
-
87
-
88
-
89
-
90
-
91
-
92
-
93
-
94
-
95
-
96
-
97
-
98
-
99
-
100
-
101
-
102
-
103
-
104
-
105
-
106
-
107
-
108
-
109
-
110
-
111
-
112
-
113
-
114
-
115
-
116
-
117
-
118
-
119
-
120
-
121
-
122
-
123
-
124
-
125
-
126
-
127
-
128
-
129
-
130
-
131
-
132
-
133
-
134
-
135
-
136
-
137
-
138
-
139
-
140
-
141
-
142
-
143
-
144
-
145
-
146
-
147
-
148
-
149
-
150
-
151
-
152
-
153
-
154
-
155
-
156
-
157
-
158
-
159
-
160
-
161
-
162
-
163
-
164
-
165
-
166
-
167
-
168
-
169
-
170
-
171
-
172
-
173
-
174
-
175
-
176
-
177
-
178
-
179
-
180
-
181
-
182
-
183
-
184
-
185
-
186
-
187
-
188
-
189
-
190
-
191
-
192
-
193
-
194
-
195
-
196
-
197
-
198
-
199
-
200
-
201
-
202
-
203
-
204
-
205
-
206
-
207
-
208
-
209
-
210
-
211
-
212
-
213
-
214
-
215
-
216
-
217
-
218
-
219
-
220
-
221
-
222
-
223
-
224
-
225
-
226
-
227
-
228
-
229
-
230
-
231
-
232
-
233
-
234
-
235
-
236
-
237
-
238
-
239
-
240
-
241
-
242
-
243
-
244
-
245
-
246
-
247
-
248
-
249
-
250
-
251
-
252
-
253
-
254
-
255
-
256
-
257
-
258
-
259
-
260
-
261
-
262
-
263
-
264
-
265
-
266
-
267
-
268
-
269
-
270
-
271
-
272
-
273
-
274
-
275
-
276
-
277
-
278
-
279
-
280
-
281
-
282
-
283
 |
 |

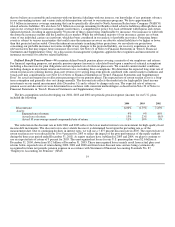
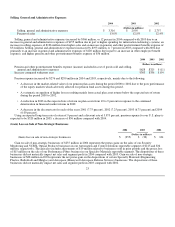
Selling, General and Administrative Expenses
2004 2003 2002
(Dollars in millions)
Selling, general and administrative expenses $ 3,316 $ 2,950 $ 2,757
Percent of sales 13.0% 12.8% 12.4%
Selling, general and administrative expenses increased by $366 million, or 12 percent in 2004 compared with 2003 due to an
increase in general and administrative expenses of $155 million due in part to higher spending for information technology systems, an
increase in selling expenses of $136 million from higher sales and an increase in pension and other postretirement benefits expense of
$54 million. Selling, general and administrative expenses increased by $193 million, or 7 percent in 2003 compared with 2002 due
primarily to an increase in general and administrative expenses of $120 million due in part to an increase in other employee benefit
expenses, and higher pension and other postretirement benefits expense of $56 million.
2004 2003 2002
(Dollars in millions)
Pension and other postretirement benefits expense (income) included in cost of goods sold and selling,
general and administrative expenses $628 $325 $ (11)
Increase compared with prior year $303 $336 $154
Pension expense increased by $276 and $290 million in 2004 and 2003, respectively, mainly due to the following:
• A decrease in the market-related value of our pension plan assets during the period 2000 to 2002 due to the poor performance
of the equity markets which adversely affected our pension fund assets during this period.
• A systematic recognition of higher losses resulting mainly from actual plan asset returns below the expected rate of return
during the period 2000 to 2002.
• A reduction in 2003 in the expected rate of return on plan assets from 10 to 9 percent in response to the continued
deterioration in financial market returns in 2002.
• A decrease in the discount rate for each of the years 2001 (7.75 percent), 2002 (7.25 percent), 2003 (6.75 percent) and 2004
(6.00 percent).
Using an expected long-term rate of return of 9 percent and a discount rate of 5.875 percent, pension expense for our U.S. plans is
expected to be $320 million in 2005, a decrease of $56 million compared with 2004.
(Gain) Loss on Sale of Non-Strategic Businesses
2004 2003 2002
(Dollars in millions)
(Gain) loss on sale of non-strategic businesses $ (255) $ (38) $ 124
Gain on sale of non-strategic businesses of $255 million in 2004 represents the pretax gains on the sales of our Security
Monitoring and VCSEL Optical Products businesses in our Automation and Control Solutions reportable segment of $215 and $36
million, respectively. The gain also includes adjustments of $19 million related to businesses sold in prior periods and the pretax loss
of $15 million on the sale of our Performance Fibers business in our Specialty Materials reportable segment. The dispositions of these
businesses did not materially impact net sales and segment profit in 2004 compared with 2003. Gain on sale of non-strategic
businesses of $38 million in 2003 represents the net pretax gain on the dispositions of certain Specialty Materials (Engineering
Plastics, Rudolstadt and Metglas) and Aerospace (Honeywell Aerospace Defense Services) businesses. The dispositions of these
businesses did not materially impact net sales and segment profit in 2003 compared with 2002.
23