Holiday Inn 2005 Annual Report Download - page 91
Download and view the complete annual report
Please find page 91 of the 2005 Holiday Inn annual report below. You can navigate through the pages in the report by either clicking on the pages listed below, or by using the keyword search tool below to find specific information within the annual report.-
 1
1 -
2
-
3
-
4
-
5
-
6
-
7
-
8
-
9
-
10
-
11
-
12
-
13
-
14
-
15
-
16
-
17
-
18
-
19
-
20
-
21
-
22
-
23
-
24
-
25
-
26
-
27
-
28
-
29
-
30
-
31
-
32
-
33
-
34
-
35
-
36
-
37
-
38
-
39
-
40
-
41
-
42
-
43
-
44
-
45
-
46
-
47
-
48
-
49
-
50
-
51
-
52
-
53
-
54
-
55
-
56
-
57
-
58
-
59
-
60
-
61
-
62
-
63
-
64
-
65
-
66
-
67
-
68
-
69
-
70
-
71
-
72
-
73
-
74
-
75
-
76
-
77
-
78
-
79
-
80
-
 81
81 -
 82
82 -
 83
83 -
 84
84 -
 85
85 -
 86
86 -
 87
87 -
 88
88 -
 89
89 -
 90
90 -
 91
91 -
 92
92
 |
 |

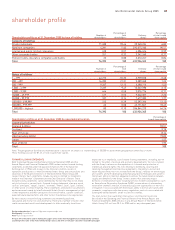
Percentage of Percentage
Number of total Ordinary of total issued
Shareholder profile as at 31 December 2005 by type of holding shareholders shareholders shares share capital
Category of holdings
Private individuals 71,400 93.46 29,540,234 6.83
Nominee companies 4,281 5.65 392,075,180 90.57
Limited and public limited companies 438 0.57 4,306,424 0.99
Other corporate bodies 251 0.32 3,342,260 0.77
Pension funds, insurance companies and banks 23 0.00 3,672,247 0.84
Total 76,393 100 432,936,345 100
Percentage of Percentage
Number of total Ordinary of total issued
shareholders shareholders shares share capital
Range of holdings
1 – 199 42,273 55.35 2,959,078 0.68
200 – 499 16,283 21.31 5,289,260 1.22
500 – 999 9,267 12.13 6,480,716 1.50
1,000 – 4,999 7,237 9.47 13,537,390 3.13
5,000 – 9,999 444 0.58 3,076,776 0.71
10,000 – 49,999 417 0.55 9,522,307 2.20
50,000 – 99,999 107 0.14 7,677,385 1.77
100,000 – 499,999 223 0.29 52,397,366 12.10
500,000 – 999,999 62 0.08 45,151,847 10.43
1,000,000 – highest 80 0.10 286,844,220 66.26
Total 76,393 100 432,936,345 100
Percentage of
Shareholder profile as at 31 December 2005 by geographical location issued share capital
Country/Jurisdiction
England & Wales 59.51
Scotland 9.78
Rest of Europe 8.14
USA (including ADRs) 19.05
Japan 1.57
Rest of World 1.95
Total 100
Note: The geographical distribution presented above is based on an analysis of shareholdings of 150,000 or above where geographical ownership is known.
These holdings account for 87.4% of total issued share capital.
shareholder profile
InterContinental Hotels Group 2005 89
FORWARD-LOOKING STATEMENTS
Both the Annual Review and Summary Financial Statement 2005 and the
Annual Report and Financial Statements 2005 contain certain forward-looking
statements as defined under US legislation (Section 21E of the Securities
Exchange Act of 1934) with respect to the financial condition, results of
operations and business of InterContinental Hotels Group and certain plans and
objectives of the Board of Directors of InterContinental Hotels Group with
respect thereto. Such statements include, but are not limited to, statements
made in the Chairman’s Statement and the Chief Executive’s Review. These
forward-looking statements can be identified by the fact that they do not relate
only to historical or current facts. Forward-looking statements often use words
such as ‘anticipate’, ‘target’, ‘expect’, ‘estimate’, ‘intend’, ‘plan’, ‘goal’, ‘believe’,
or other words of similar meaning. These statements are based on assumptions
and assessments made by InterContinental Hotels Group’s management in light
of their experience and their perception of historical trends, current conditions,
expected future developments and other factors they believe to be appropriate.
By their nature, forward-looking statements are inherently predictive,
speculative and involve risk and uncertainty. There are a number of factors that
could cause actual results and developments to differ materially from those
expressed in, or implied by, such forward-looking statements, including, but not
limited to: the effect of political and economic developments; the risks involved
with the Group’s reliance on the reputation of its brands and protection of
intellectual property rights; the risks relating to identifying, securing and
retaining management and franchise agreements; the ability to recruit and
retain key personnel; the risks involved with the Group’s reliance on technologies
and systems and with developing and employing new technologies and systems;
the Group’s ability to maintain adequate insurance; the future balance between
supply and demand for the Group’s hotels; events that adversely impact
domestic or international travel, including terrorist incidents and epidemics such
as Severe Acute Respiratory Syndrome (SARS); increased use of intermediary
reservation channels; the lack of selected acquisition opportunities or the risks
of litigation; risks associated with the Group’s ability to borrow and satisfy debt
covenants; compliance with data privacy regulations; and risks associated with
funding the defined benefits under its pension schemes.
The main factors that could affect the business and financial results are
described in the Operating and Financial Review of the Annual Report and
Financial Statements 2005 and also in any Annual Report of InterContinental
Hotels Group PLC on Form 20-F for 2005 and for any subsequent year.
Design and production Corporate Edge www.corporateedge.com
Photography VisualMedia
Print Royle Corporate Print
At least 30% of the fibre used in making this paper comes from well-managed forests independently certified
according to the rules of the Forest Stewardship Council, and 30% is from post-consumer recycled waste paper