Holiday Inn 2005 Annual Report Download - page 14
Download and view the complete annual report
Please find page 14 of the 2005 Holiday Inn annual report below. You can navigate through the pages in the report by either clicking on the pages listed below, or by using the keyword search tool below to find specific information within the annual report.-
 1
1 -
2
-
3
-
 4
4 -
 5
5 -
 6
6 -
 7
7 -
 8
8 -
 9
9 -
 10
10 -
 11
11 -
 12
12 -
 13
13 -
 14
14 -
 15
15 -
 16
16 -
 17
17 -
 18
18 -
 19
19 -
 20
20 -
 21
21 -
 22
22 -
 23
23 -
 24
24 -
25
-
26
-
27
-
28
-
29
-
30
-
31
-
32
-
33
-
34
-
35
-
36
-
37
-
38
-
39
-
40
-
41
-
42
-
43
-
44
-
45
-
46
-
47
-
48
-
49
-
50
-
51
-
52
-
53
-
54
-
55
-
56
-
57
-
58
-
59
-
60
-
61
-
62
-
63
-
64
-
65
-
66
-
67
-
68
-
69
-
70
-
71
-
72
-
73
-
74
-
75
-
76
-
77
-
78
-
79
-
80
-
81
-
82
-
83
-
84
-
85
-
86
-
87
-
88
-
89
-
90
-
91
-
92
 |
 |

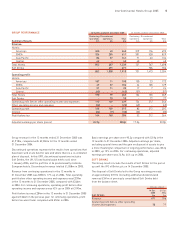
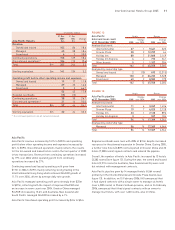
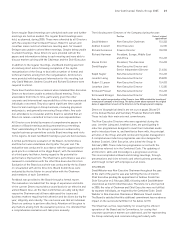
12 months ended
31 Dec 31 Dec
2005 2004 Change
Central Results £m £m %
Revenue 42 40 5.0
Gross central costs (107) (97) 10.3
Net central costs £m (65) (57) 14.0
Dollar equivalent $m (118) (102) 15.7
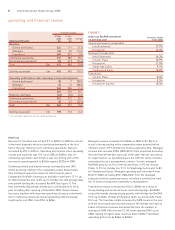
CENTRAL
Net central overheads increased by £8m reflecting increased
governance costs, further investment to support development
and the accounting treatment of share scheme costs. Under IFRS,
the charges for share option schemes established after November
2002 are accounted for in the income statement. As share scheme
awards are generally made annually and the accounting cost is
spread over three years, 2005 is the first year that a full annual cost
is taken into account. Total Hotels’ overheads were flat year-on-year
after adjusting for inflation.
OTHER OPERATING INCOME AND EXPENSES
Other operating income and expenses totalled a net expense
of £22m in 2005 compared with a net expense of £49m in 2004.
The £22m net expense in 2005 included:
• £13m costs relating to the further restructuring of the
Hotels business;
• £9m costs of property damage relating to fire and natural
disasters;
• £7m charge for impairment of property; and
• £7m credit for employee benefits curtailment as a result of the
UK hotels disposal.
Other operating income and expenses are by their size and nature
considered to be exceptional and are shown as special items and
excluded from the calculation of adjusted earnings per share to
give a more meaningful comparison of performance.
NET FINANCING COSTS
Net financing costs totalled £33m in 2005, the same as in 2004. In
2005, £9m related to Soft Drinks and is classified as discontinued
operations. The prior year net financing expense included a net
£11m charge that is treated as a special item and is excluded from
the calculation of adjusted earnings per share.
TAXATION
The effective rate of tax on profit before tax, excluding the impact
of special items, was 28.6%. By also excluding the impact of prior
year items, which are included wholly within continuing operations,
the equivalent effective tax rate would be 37.8%. This rate is higher
than the UK statutory rate of 30% due mainly to overseas profits
being taxed at rates higher than the UK statutory rate. The
equivalent effective rates for 2004, restated under IFRS, were
17.3% and 38.6% respectively.
Taxation special items totalled an £8m credit (2004 £183m credit).
In 2005, this represented the release of provisions which were
special by reason of their size or incidence, relating to tax matters
which were settled during the year, or in respect of which the
statutory limitation period had expired. In 2004, taxation special
items, in addition to such provision releases, included £83m for the
recognition of a deferred tax asset in respect of capital losses.
Net tax paid in 2005 was £91m (2004 £35m) including £11m in
respect of disposals.
GAIN ON DISPOSAL OF ASSETS
The gain on disposal of assets, net of related tax, totalled £311m
in 2005 and mainly comprised a net gain on disposal of Soft Drinks
of £284m and a net gain on hotel asset disposals of £27m.
EARNINGS
Basic earnings per share for 2005 were 95.2p, compared with 53.9p
in 2004. Adjusted earnings per share, removing the non-comparable
special items and gain on disposal of assets, were 38.2p, against
33.9p in 2004. Adjusted earnings per share for continuing
operations were 24.9p, 44% up on last year.
DIVIDENDS
The Board has proposed a final dividend per share of 10.70p;
with the interim dividend of 4.60p the normal dividend for 2005
totalled 15.30p.
SHARE PRICE AND MARKET CAPITALISATION
The InterContinental Hotels Group PLC share price closed at
839.50p on 31 December 2005, up from 647.50p on 31 December
2004. The market capitalisation of the Group at the year end was
£3.6bn.
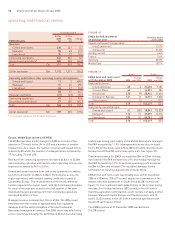
CAPITAL EXPENDITURE AND CASH FLOW
The net movement in cash and cash equivalents in the 12 months
to 31 December 2005 was an inflow of £259m. This included a cash
inflow from operations of £423m, and a net cash inflow from
investing activities of £1,863m.
Proceeds from the disposal of operations and other financial
assets totalled £2,046m and included proceeds from the sale of
Soft Drinks £220m and hotels £1,826m.
Capital expenditure for Hotels totalled £136m, lower than 2004
as the Group continued its asset disposal programme. Capital
expenditure in 2005 for Hotels included the InterContinental
London and Holiday Inn Munich City Centre refurbishments and
a rolling rooms refurbishment programme at the InterContinental
Hong Kong.
operating and financial review
12 InterContinental Hotels Group 2005