Holiday Inn 2005 Annual Report Download - page 8
Download and view the complete annual report
Please find page 8 of the 2005 Holiday Inn annual report below. You can navigate through the pages in the report by either clicking on the pages listed below, or by using the keyword search tool below to find specific information within the annual report.-
 1
1 -
 2
2 -
 3
3 -
 4
4 -
 5
5 -
 6
6 -
 7
7 -
 8
8 -
 9
9 -
 10
10 -
 11
11 -
 12
12 -
 13
13 -
 14
14 -
 15
15 -
 16
16 -
 17
17 -
 18
18 -
 19
19 -
20
-
21
-
22
-
23
-
24
-
25
-
26
-
27
-
28
-
29
-
30
-
31
-
32
-
33
-
34
-
35
-
36
-
37
-
38
-
39
-
40
-
41
-
42
-
43
-
44
-
45
-
46
-
47
-
48
-
49
-
50
-
51
-
52
-
53
-
54
-
55
-
56
-
57
-
58
-
59
-
60
-
61
-
62
-
63
-
64
-
65
-
66
-
67
-
68
-
69
-
70
-
71
-
72
-
73
-
74
-
75
-
76
-
77
-
78
-
79
-
80
-
81
-
82
-
83
-
84
-
85
-
86
-
87
-
88
-
89
-
90
-
91
-
92
 |
 |

6InterContinental Hotels Group 2005
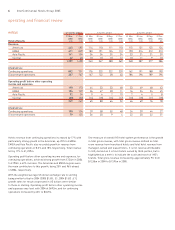
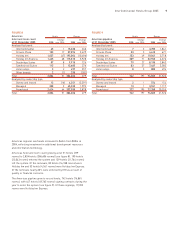
Hotels revenue from continuing operations increased by 17% with
particularly strong growth in the Americas, up 25% to £400m.
EMEA and Asia Pacific also recorded growth in revenue from
continuing operations of 8.3% and 18% respectively. Total revenue
fell by 17% to £1,239m.
Operating profit before other operating income and expenses, for
continuing operations, achieved strong growth from £134m in 2004
to £190m, a 42% increase. The Americas and EMEA regions were
the main contributors to this growth, being 25% and 96% ahead
of 2004, respectively.
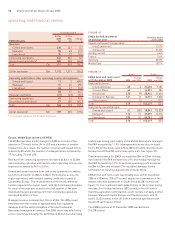
With the weighted average US dollar exchange rate to sterling
being similar to that in 2004 (2005 $1.83 : £1, 2004 $1.82 : £1),
growth rates for results expressed in US dollars were similar
to those in sterling. Operating profit before other operating income
and expenses was level with 2004 at $492m, and for continuing
operations increased by 43% to $347m.
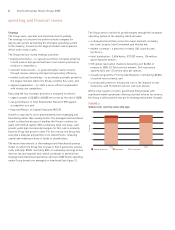
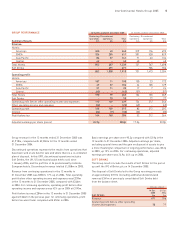
One measure of overall IHG hotel system performance is the growth
in total gross revenue, with total gross revenue defined as total
room revenue from franchised hotels and total hotel revenue from
managed, owned and leased hotels. It is not revenue attributable
to IHG, derived as it is from hotels owned by third-parties, but is
highlighted as a metric to indicate the scale and reach of IHG’s
brands. Total gross revenue increased by approximately 9% from
$12.8bn in 2004 to $13.9bn in 2005.
operating and financial review
HOTELS 12 months ended 3 months ended 3 months ended
31 Dec 31 Dec 31 Mar 30 Jun 30 Sep 31 Dec 31 Mar 30 Jun 30 Sep 31 Dec
2005 2004 2005 2005 2005 2005 2004 2004 2004 2004
Hotels Results £m £m £m £m £m £m £m £m £m £m
Revenue:
Americas 445 495 114 110 111 110 115 131 125 124
EMEA 611 829 183 191 124 113 190 214 212 213
Asia Pacific 141 134 36 36 35 34 33 31 31 39
Central 42 40 10 10 10 12 10 11 9 10
1,239 1,498 343 347 280 269 348 387 377 386
Analysed as:
Continuing operations 852 731 176 225 222 229 162 191 188 190
Discontinued operations 387 767 167 122 58 40 186 196 189 196
Operating profit before other operating
income and expenses:
Americas 198 173 44 53 53 48 33 49 48 43
EMEA 104 129 26 47 20 11 16 34 34 45
Asia Pacific 32 24967107458
Central (65) (57) (14) (18) (16) (17) (10) (18) (11) (18)
269 269 65 88 64 52 46 69 76 78
Analysed as:
Continuing operations 190 134 29 58 55 48 24 39 44 27
Discontinued operations 79 135 36 30 9 4 22 30 32 51