Holiday Inn 2005 Annual Report Download - page 47
Download and view the complete annual report
Please find page 47 of the 2005 Holiday Inn annual report below. You can navigate through the pages in the report by either clicking on the pages listed below, or by using the keyword search tool below to find specific information within the annual report.-
 1
1 -
2
-
3
-
4
-
5
-
6
-
7
-
8
-
9
-
10
-
11
-
12
-
13
-
14
-
15
-
16
-
17
-
18
-
19
-
20
-
21
-
22
-
23
-
24
-
25
-
26
-
27
-
28
-
29
-
30
-
31
-
32
-
33
-
34
-
35
-
36
-
 37
37 -
 38
38 -
 39
39 -
 40
40 -
 41
41 -
 42
42 -
 43
43 -
 44
44 -
 45
45 -
 46
46 -
 47
47 -
 48
48 -
 49
49 -
 50
50 -
 51
51 -
 52
52 -
 53
53 -
 54
54 -
 55
55 -
 56
56 -
 57
57 -
58
-
59
-
60
-
61
-
62
-
63
-
64
-
65
-
66
-
67
-
68
-
69
-
70
-
71
-
72
-
73
-
74
-
75
-
76
-
77
-
78
-
79
-
80
-
81
-
82
-
83
-
84
-
85
-
86
-
87
-
88
-
89
-
90
-
91
-
92
 |
 |

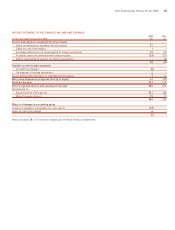
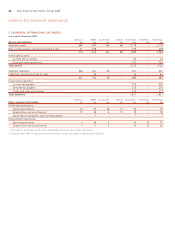
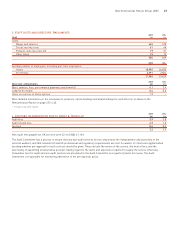
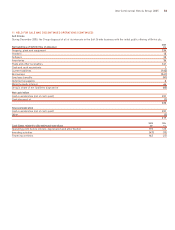
2 SEGMENTAL INFORMATION (CONTINUED)
Year ended 31 December 2004*
Americas EMEA Asia Pacific Central Total Hotels
Revenue £m £m £m £m £m
Hotels
Owned and leased 93 231 47 – 371
Managed 30 43 21 – 94
Franchised 196 27 3 – 226
Central – – – 40 40
Continuing operations 319 301 71 40 731
Discontinued operations – owned and leased 176 528 63 – 767
495 829 134 40 1,498
Continuing Discontinued Group
£m £m £m
Group
Hotels 731 767 1,498
Soft Drinks – 706 706
Total revenue 731 1,473 2,204
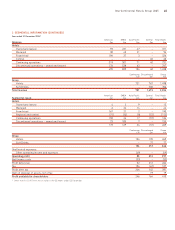
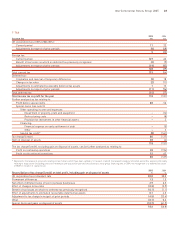
Americas EMEA Asia Pacific Central Total Hotels
Segmental result £m £m £m £m £m
Hotels
Owned and leased 429–15
Managed 62414 –44
Franchised 167 21 2 – 190
Regional and central (27) (23) (8) (57) (115)
Continuing operations 150 24 17 (57) 134
Discontinued operations – owned and leased 23 105 7 – 135
173 129 24 (57) 269
Continuing Discontinued Group
£m £m £m
Group
Hotels 134 135 269
Soft Drinks –7777
134 212 346
Unallocated expenses:
Other operating income and expenses (49) – (49)
Operating profit 85 212 297
Net finance costs (33) – (33)
Profit before tax 52 212 264
Tax 194 (67) 127
Profit after tax 246 145 391
Gain on disposal of assets, net of tax –1919
Profit available for shareholders 246 164 410
* Other than for Soft Drinks which reflects the 53 weeks ended 25 December.
InterContinental Hotels Group 2005 45