Holiday Inn 2005 Annual Report Download - page 10
Download and view the complete annual report
Please find page 10 of the 2005 Holiday Inn annual report below. You can navigate through the pages in the report by either clicking on the pages listed below, or by using the keyword search tool below to find specific information within the annual report.-
 1
1 -
 2
2 -
 3
3 -
 4
4 -
 5
5 -
 6
6 -
 7
7 -
 8
8 -
 9
9 -
 10
10 -
 11
11 -
 12
12 -
 13
13 -
 14
14 -
 15
15 -
 16
16 -
 17
17 -
 18
18 -
 19
19 -
 20
20 -
 21
21 -
22
-
23
-
24
-
25
-
26
-
27
-
28
-
29
-
30
-
31
-
32
-
33
-
34
-
35
-
36
-
37
-
38
-
39
-
40
-
41
-
42
-
43
-
44
-
45
-
46
-
47
-
48
-
49
-
50
-
51
-
52
-
53
-
54
-
55
-
56
-
57
-
58
-
59
-
60
-
61
-
62
-
63
-
64
-
65
-
66
-
67
-
68
-
69
-
70
-
71
-
72
-
73
-
74
-
75
-
76
-
77
-
78
-
79
-
80
-
81
-
82
-
83
-
84
-
85
-
86
-
87
-
88
-
89
-
90
-
91
-
92
 |
 |

8InterContinental Hotels Group 2005
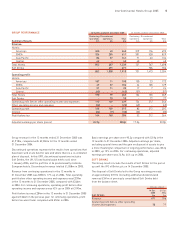
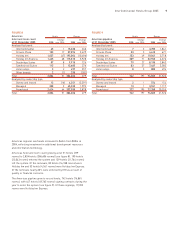
12 months ended
31 Dec 31 Dec
2005 2004 Change
Americas Results $m $m %
Revenue:
Owned and leased 224 171 31.0
Managed 118 55 114.5
Franchised 389 357 9.0
Continuing operations 731 583 25.4
Discontinued operations* 82 319 (74.3)
Total $m 813 902 (9.9)
Sterling equivalent £m 445 495 (10.1)
Operating profit before other operating income and expenses:
Owned and leased 28 7 300.0
Managed 36 12 200.0
Franchised 340 304 11.8
404 323 25.1
Regional overheads (62) (50) 24.0
Continuing operations 342 273 25.3
Discontinued operations* 20 42 (52.4)
Total $m 362 315 14.9
Sterling equivalent £m 198 173 14.5
* Discontinued operations are all owned and leased.
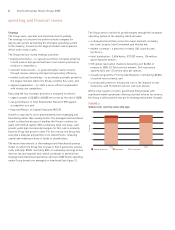
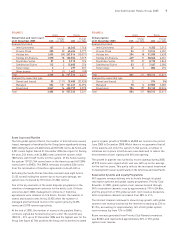
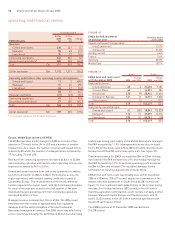
FIGURE 7
Americas RevPAR movement 12 months ended
on previous year 31 Dec 2005
Owned and leased (comparable):
InterContinental 17.7%
Holiday Inn 14.0%
Managed (comparable):
InterContinental 16.2%
Crowne Plaza 12.9%
Holiday Inn 11.0%
Staybridge Suites 9.1%
Candlewood Suites 14.8%
Franchised:
Crowne Plaza 8.4%
Holiday Inn 9.2%
Holiday Inn Express 10.3%
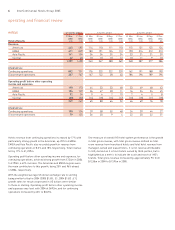
operating and financial review
Americas
Revenue for the Americas fell by 9.9% to $813m in 2005 as a result
of the hotel disposals which occurred predominantly in the first
half of the year. Revenue from continuing operations, however,
increased by 25% to $731m. Operating profit before other operating
income and expenses was 15% up on 2004 at $362m, and for
continuing operations, performance was very strong with a 25%
increase in operating profit to $342m against $273m in 2004.
Continuing owned and leased revenue increased by over 30%
driven by strong trading in the comparable estate (those hotels
fully trading as owned and leased in both financial years).
Comparable RevPARs (revenue per available room) were 17.7% up
for InterContinental and 14.0% up for Holiday Inn with average daily
rate growth fuelling the increased RevPAR (see figure 7). The
InterContinental Buckhead, Atlanta also contributed its first full
year of trading after opening in November 2004. These revenue
increases together with improved operating efficiency in the hotels
led to continuing owned and leased operating profit increasing
significantly over 2004, from $7m to $28m.
Managed revenue increased from $55m in 2004 to $118m as a
result of strong trading in the comparable estate boosted by the
13 hotels sold to HPT and the two hotels acquired by SHC. Managed
revenue also includes $70m (2004 $27m) from properties (including
the InterContinental San Juan sold in the year) that are structured,
for legal reasons, as operating leases but with the same economic
characteristics as a management contract. Overall, managed
RevPARs grew by 16.2% for InterContinental, 12.9% for Crowne
Plaza, 11.0% for Holiday Inn, 9.1% for Staybridge Suites and 14.8%
for Candlewood Suites. Managed operating profit increased from
$12m to $36m including $9m (2004 $3m) from the managed
properties held as operating leases, including a contribution from
the 15 hotels moving from ownership to management.
Franchised revenue increased by 9.0% to $389m as a result of
strong trading and increased room count and signings. RevPARs
across the brands showed strong growth, with Holiday Inn RevPAR
9.2% up on 2004, Holiday Inn Express 10.3% up and Crowne Plaza
8.4% up. The franchise estate increased by 3,878 rooms in the year
with the most significant increase being in the Holiday Inn Express
brand. Franchised revenue also benefited from the number of
signings in 2005 with a record 47,245 room signings (50% up on
2004) leading to higher sales revenues than in 2004. Franchised
operating profit rose by $36m to $340m.