Holiday Inn 2005 Annual Report Download - page 13
Download and view the complete annual report
Please find page 13 of the 2005 Holiday Inn annual report below. You can navigate through the pages in the report by either clicking on the pages listed below, or by using the keyword search tool below to find specific information within the annual report.-
 1
1 -
2
-
 3
3 -
 4
4 -
 5
5 -
 6
6 -
 7
7 -
 8
8 -
 9
9 -
 10
10 -
 11
11 -
 12
12 -
 13
13 -
 14
14 -
 15
15 -
 16
16 -
 17
17 -
 18
18 -
 19
19 -
 20
20 -
 21
21 -
 22
22 -
 23
23 -
24
-
25
-
26
-
27
-
28
-
29
-
30
-
31
-
32
-
33
-
34
-
35
-
36
-
37
-
38
-
39
-
40
-
41
-
42
-
43
-
44
-
45
-
46
-
47
-
48
-
49
-
50
-
51
-
52
-
53
-
54
-
55
-
56
-
57
-
58
-
59
-
60
-
61
-
62
-
63
-
64
-
65
-
66
-
67
-
68
-
69
-
70
-
71
-
72
-
73
-
74
-
75
-
76
-
77
-
78
-
79
-
80
-
81
-
82
-
83
-
84
-
85
-
86
-
87
-
88
-
89
-
90
-
91
-
92
 |
 |

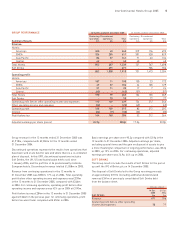
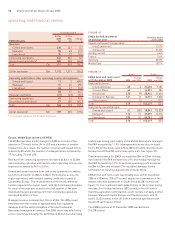
Asia Pacific
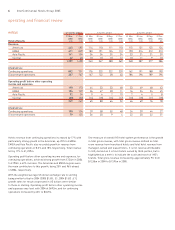
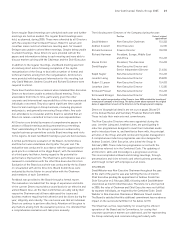
Asia Pacific revenue increased by 5.3% to $257m and operating
profit before other operating income and expenses increased by
34% to $59m. Discontinued operations mainly reflects the results
for the ten owned and leased hotels sold in the last quarter of 2005
in two transactions. Revenue from continuing operations increased
by 19% over 2004 whilst operating profit from continuing
operations increased by 27%.
Continuing owned and leased operating profit grew from
$17m in 2004 to $19m mainly reflecting strong trading in the
InterContinental Hong Kong which achieved RevPAR growth of
11.7% over 2004, driven by average daily rate growth.
Asia Pacific managed operating profit grew strongly from $25m
to $29m, reflecting both the impact of improved RevPAR and
an increase in room count over 2004. Greater China managed
RevPAR increased by 13.6% and Australia, New Zealand and
South Pacific managed RevPAR increased by 6.1%.
Asia Pacific franchised operating profit increased by $2m to $5m.
Regional overheads were level with 2004 at $15m despite increased
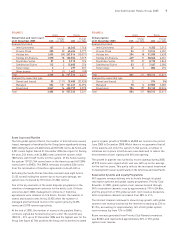
resources for the planned expansion in Greater China. During 2005,
a further nine hotels (2,839 rooms) opened in Greater China and 20
hotels (7,308 rooms) signed contracts and entered the pipeline.
Overall, the number of hotels in Asia Pacific increased by 13 hotels
(3,383 rooms) (see figure 12). During the year, ten owned and leased
hotels (2,315 rooms) in Australia, New Zealand and Fiji were sold
but retained with management contracts.
Asia Pacific pipeline grew by 14 managed hotels (4,564 rooms)
primarily in the InterContinental and Crowne Plaza brands (see
figure 13). In addition, on 15 February 2006, IHG announced that
it had signed contracts with a single owner to manage six hotels
(over 4,500 rooms) in China’s Sichuan province, and on 24 February
2006, announced that it had signed contracts with an owner to
manage four hotels, with over 1,400 rooms, also in China.
12 months ended
31 Dec 31 Dec
2005 2004 Change
Asia Pacific Results $m $m %
Revenue:
Owned and leased 102 86 18.6
Managed 45 38 18.4
Franchised 65 20.0
Continuing operations 153 129 18.6
Discontinued operations* 104 115 (9.6)
Total $m 257 244 5.3
Sterling equivalent £m 141 134 5.2
Operating profit before other operating income and expenses:
Owned and leased 19 17 11.8
Managed 29 25 16.0
Franchised 53 66.7
53 45 17.8
Regional overheads (15) (15) –
Continuing operations 38 30 26.7
Discontinued operations* 21 14 50.0
Total $m 59 44 34.1
Sterling equivalent £m 32 24 33.3
* Discontinued operations are all owned and leased.
FIGURE 12
Asia Pacific Hotels Rooms
hotel and room count Change Change
at 31 December 2005 2005 over 2004 2005 over 2004
Analysed by brand:
InterContinental 27 19,461 325
Crowne Plaza 38 212,299 64
Holiday Inn 88 721,868 2,149
Holiday Inn Express 42773 541
Other brands 51 1,107 304
Total 162 13 45,508 3,383
Analysed by ownership type:
Owned and leased 2(10) 693 (2,315)
Managed 120 21 36,232 5,528
Franchised 40 28,583 170
Total 162 13 45,508 3,383
FIGURE 13
Hotels Rooms
Asia Pacific pipeline Change Change
at 31 December 2005 2005 over 2004 2005 over 2004
Analysed by brand:
InterContinental 11 63,269 1,436
Crowne Plaza 19 76,025 2,128
Holiday Inn 23 17,128 896
Holiday Inn Express 3–947 104
Total 56 14 17,369 4,564
Analysed by ownership type:
Managed 56 14 17,369 4,564
Total 56 14 17,369 4,564
InterContinental Hotels Group 2005 11