Holiday Inn 2005 Annual Report Download - page 12
Download and view the complete annual report
Please find page 12 of the 2005 Holiday Inn annual report below. You can navigate through the pages in the report by either clicking on the pages listed below, or by using the keyword search tool below to find specific information within the annual report.-
 1
1 -
 2
2 -
 3
3 -
 4
4 -
 5
5 -
 6
6 -
 7
7 -
 8
8 -
 9
9 -
 10
10 -
 11
11 -
 12
12 -
 13
13 -
 14
14 -
 15
15 -
 16
16 -
 17
17 -
 18
18 -
 19
19 -
 20
20 -
 21
21 -
 22
22 -
23
-
24
-
25
-
26
-
27
-
28
-
29
-
30
-
31
-
32
-
33
-
34
-
35
-
36
-
37
-
38
-
39
-
40
-
41
-
42
-
43
-
44
-
45
-
46
-
47
-
48
-
49
-
50
-
51
-
52
-
53
-
54
-
55
-
56
-
57
-
58
-
59
-
60
-
61
-
62
-
63
-
64
-
65
-
66
-
67
-
68
-
69
-
70
-
71
-
72
-
73
-
74
-
75
-
76
-
77
-
78
-
79
-
80
-
81
-
82
-
83
-
84
-
85
-
86
-
87
-
88
-
89
-
90
-
91
-
92
 |
 |

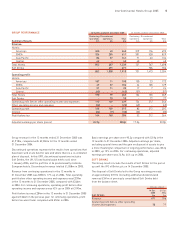
Europe, Middle East and Africa (EMEA)
The EMEA operating model changed in 2005 as a result of the
disposal of 73 hotels in the UK to LRG and a number of smaller
transactions. As a result, the number of owned and leased hotels
reduced by 85 whilst the number of managed hotels increased by
77, including 73 with LRG.
Revenue from continuing operations increased by 8.3% to £326m
and continuing operating profit before other operating income and
expenses increased by 96% to £47m.
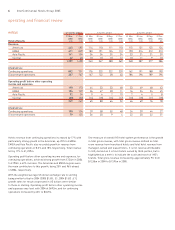
Owned and leased revenue from continuing operations increased
by 2.2% from £231m in 2004 to £236m. Performance across the
region was mixed, with variable trading conditions in parts of
Continental Europe. The refurbishment of the InterContinental
London impacted the overall result, with the hotel being disrupted
for most of the year and closed in the final quarter of the year.
Owned and leased operating profit from continuing operations
increased by £9m to £11m.
Managed revenue increased by £12m to £55m. The 2004 result
benefited from the receipt of approximately £4m liquidated
damages from the early termination of the InterContinental
Barcelona management contract. The 2005 result was affected by
a loss of earnings following the bombings in Beirut, but underlying
trading was strong, particularly in the Middle East where managed
RevPAR increased by 11.9%. Management fees are also included
from LRG for the hotels sold in May 2005 (including incentive fees);
Holiday Inn UK RevPAR overall was up by 4.6% (see figure 10).
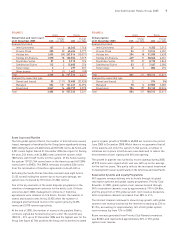
Franchised revenue for EMEA increased by £8m to £35m. Holiday
Inn franchise RevPAR increased by 4.9% and Holiday Inn Express
RevPAR increased by 5.9%. Franchised operating profit increased
by £5m to £26m and included £7m liquidated damages for the
termination of franchise agreements in South Africa.
EMEA hotel and room count was broadly level with 31 December
2004 at 610 hotels (105,419 rooms) despite the termination of the
master franchise agreement in South Africa (6,338 rooms) (see
figure 11). Two significant deals added hotels to the system during
the year; five Holiday Inn hotels (602 rooms), in the UK from a
franchise agreement with Stardon, a joint venture company formed
between Starwood Capital Europe and Chardon Hotels, and 13
hotels (2,233 rooms) in the UK from a franchise agreement with
Queens Moat Houses Limited.
The EMEA pipeline at 31 December 2005 was 86 hotels
(14,278 rooms).
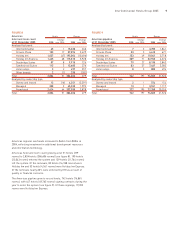
12 months ended
31 Dec 31 Dec
2005 2004 Change
EMEA Results £m £m %
Revenue:
Owned and leased 236 231 2.2
Managed 55 43 27.9
Franchised 35 27 29.6
Continuing operations 326 301 8.3
Discontinued operations* 285 528 (46.0)
Total £m 611 829 (26.3)
Dollar equivalent $m 1,115 1,511 (26.2)
Operating profit before other operating income and expenses:
Owned and leased 11 2 450.0
Managed 31 24 29.2
Franchised 26 21 23.8
68 47 44.7
Regional overheads (21) (23) (8.7)
Continuing operations 47 24 95.8
Discontinued operations* 57 105 (45.7)
Total £m 104 129 (19.4)
Dollar equivalent $m 189 235 (19.6)
* Discontinued operations are all owned and leased.
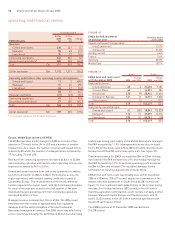
FIGURE 10
EMEA RevPAR movement 12 months ended
on previous year 31 Dec 2005
Owned and leased (comparable):
InterContinental 13.3%
Holiday Inn (5.3)%
Holiday Inn UK 4.6%
France 5.6%
Germany (0.3)%
Middle East 18.7%
FIGURE 11
Hotels Rooms
EMEA hotel and room count Change Change
at 31 December 2005 2005 over 2004 2005 over 2004
Analysed by brand:
InterContinental 65 321,473 1,181
Crowne Plaza 64 116,031 284
Holiday Inn 320 (9) 50,944 (2,624)
Holiday Inn Express 161 816,971 1,050
Other brands –(1) –(222)
Total 610 2105,419 (331)
Analysed by ownership type:
Owned and leased 41 (85) 10,541 (15,029)
Managed 176 77 39,697 14,776
Franchised 393 10 55,181 (78)
Total 610 2105,419 (331)
operating and financial review
10 InterContinental Hotels Group 2005