Holiday Inn 2005 Annual Report Download - page 80
Download and view the complete annual report
Please find page 80 of the 2005 Holiday Inn annual report below. You can navigate through the pages in the report by either clicking on the pages listed below, or by using the keyword search tool below to find specific information within the annual report.-
 1
1 -
2
-
3
-
4
-
5
-
6
-
7
-
8
-
9
-
10
-
11
-
12
-
13
-
14
-
15
-
16
-
17
-
18
-
19
-
20
-
21
-
22
-
23
-
24
-
25
-
26
-
27
-
28
-
29
-
30
-
31
-
32
-
33
-
34
-
35
-
36
-
37
-
38
-
39
-
40
-
41
-
42
-
43
-
44
-
45
-
46
-
47
-
48
-
49
-
50
-
51
-
52
-
53
-
54
-
55
-
56
-
57
-
58
-
59
-
60
-
61
-
62
-
63
-
64
-
65
-
66
-
67
-
68
-
69
-
 70
70 -
 71
71 -
 72
72 -
 73
73 -
 74
74 -
 75
75 -
 76
76 -
 77
77 -
 78
78 -
 79
79 -
 80
80 -
 81
81 -
 82
82 -
 83
83 -
 84
84 -
 85
85 -
 86
86 -
 87
87 -
 88
88 -
 89
89 -
 90
90 -
91
-
92
 |
 |

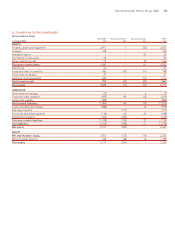
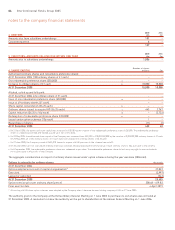
NET INCOME IN ACCORDANCE WITH US GAAP
The significant adjustments required to convert profit available for IHG equity holders in accordance with IFRS to net income in accordance
with US GAAP are:
31 Dec 31 Dec 31 Dec 31 Dec
2005 2004 2005a2004a
£m £m $m $m
Profit available for IHG equity holders in accordance with IFRS 496 383 906 700
Adjustments:
Pension costs (20) (9) (37) (17)
Amortisation of intangible assets (1) (3) (2) (6)
Depreciation of property, plant and equipment (31) (20) (57) (36)
Disposal of property, plant and equipment (107) 5(196) 9
Impairment of property, plant and equipment (17) 30 (30) 55
Provisions (3) (5) (4) (9)
Gain on held for sale equity investment –(28) –(51)
Staff costs (3) 2(6) 3
Deferred revenue 12 522 10
Change in fair value of derivativesb652 11 95
Deferred tax: on above adjustments 17 431 7
methodology (2) (79) (3) (145)
(149) (46) (271) (85)
Minority share of above adjustments 4374
(145) (43) (264) (81)
Net income in accordance with US GAAP 351 340 642 619
Analysed as:
Continuing operations 100 257 183 467
Discontinued operations 251 83 459 152
351 340 642 619
31 Dec 31 Dec 31 Dec 31 Dec
2005 2004 2005a2004a
Basiccnet income per American Depositary Share ££$$
Continuing operations 0.19 0.36 0.35 0.66
Discontinued operations 0.48 0.12 0.88 0.21
0.67 0.48 1.23 0.87
Diluteddnet income per American Depositary Share
Continuing operations 0.19 0.35 0.34 0.65
Discontinued operations 0.47 0.12 0.86 0.21
0.66 0.47 1.20 0.86
a Translated at the weighted average rate of exchange for the period of £1 = $1.83 (2004 £1 = $1.82).
b Comprises net gains in the fair value of derivatives that do not qualify for hedge accounting of £6m (2004 £50m) and net gains reclassified from other comprehensive
income of £nil (2004 £2m).
c Calculated by dividing net income in accordance with US GAAP of £351m (2004 £340m) by 521 million (2004 710 million) shares, being the weighted average number
of ordinary shares in issue during the year. Each American Depositary Share represents one ordinary share.
d Calculated by dividing net income in accordance with US GAAP of £351m by 533 million (2004 720 million) shares, being the weighted average number of dilutive
ordinary shares.
US GAAP information
78 InterContinental Hotels Group 2005