Holiday Inn 2005 Annual Report Download - page 45
Download and view the complete annual report
Please find page 45 of the 2005 Holiday Inn annual report below. You can navigate through the pages in the report by either clicking on the pages listed below, or by using the keyword search tool below to find specific information within the annual report.-
 1
1 -
2
-
3
-
4
-
5
-
6
-
7
-
8
-
9
-
10
-
11
-
12
-
13
-
14
-
15
-
16
-
17
-
18
-
19
-
20
-
21
-
22
-
23
-
24
-
25
-
26
-
27
-
28
-
29
-
30
-
31
-
32
-
33
-
34
-
 35
35 -
 36
36 -
 37
37 -
 38
38 -
 39
39 -
 40
40 -
 41
41 -
 42
42 -
 43
43 -
 44
44 -
 45
45 -
 46
46 -
 47
47 -
 48
48 -
 49
49 -
 50
50 -
 51
51 -
 52
52 -
 53
53 -
 54
54 -
 55
55 -
56
-
57
-
58
-
59
-
60
-
61
-
62
-
63
-
64
-
65
-
66
-
67
-
68
-
69
-
70
-
71
-
72
-
73
-
74
-
75
-
76
-
77
-
78
-
79
-
80
-
81
-
82
-
83
-
84
-
85
-
86
-
87
-
88
-
89
-
90
-
91
-
92
 |
 |

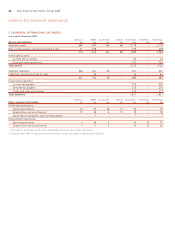
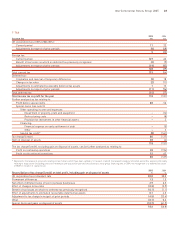
2 SEGMENTAL INFORMATION (CONTINUED)
Year ended 31 December 2005*
Americas EMEA Asia Pacific Central Total Hotels
Revenue £m £m £m £m £m
Hotels
Owned and leased 122 236 56 – 414
Managed 65 55 25 – 145
Franchised 213 35 3 – 251
Central – – – 42 42
Continuing operations 400 326 84 42 852
Discontinued operations – owned and leased 45 285 57 – 387
445 611 141 42 1,239
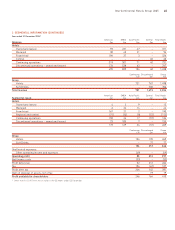
Continuing Discontinued Group
£m £m £m
Group
Hotels 852 387 1,239
Soft Drinks – 671 671
Total revenue 852 1,058 1,910
Americas EMEA Asia Pacific Central Total Hotels
Segmental result £m £m £m £m £m
Hotels
Owned and leased 15 11 11 – 37
Managed 20 31 16 – 67
Franchised 186 26 2 – 214
Regional and central (34) (21) (8) (65) (128)
Continuing operations 187 47 21 (65) 190
Discontinued operations – owned and leased 11 57 11 – 79
198 104 32 (65) 269
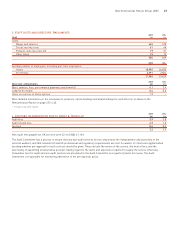
Continuing Discontinued Group
£m £m £m
Group
Hotels 190 79 269
Soft Drinks –7070
190 149 339
Unallocated expenses:
Other operating income and expenses (22) – (22)
Operating profit 168 149 317
Net finance costs (24) (9) (33)
Profit before tax 144 140 284
Tax (28) (52) (80)
Profit after tax 116 88 204
Gain on disposal of assets, net of tax – 311 311
Profit available for shareholders 116 399 515
* Other than for Soft Drinks which reflects the 50 weeks and three days ended 14 December.
InterContinental Hotels Group 2005 43