Holiday Inn 2005 Annual Report Download - page 7
Download and view the complete annual report
Please find page 7 of the 2005 Holiday Inn annual report below. You can navigate through the pages in the report by either clicking on the pages listed below, or by using the keyword search tool below to find specific information within the annual report.-
 1
1 -
 2
2 -
 3
3 -
 4
4 -
 5
5 -
 6
6 -
 7
7 -
 8
8 -
 9
9 -
 10
10 -
 11
11 -
 12
12 -
 13
13 -
 14
14 -
 15
15 -
 16
16 -
 17
17 -
 18
18 -
19
-
20
-
21
-
22
-
23
-
24
-
25
-
26
-
27
-
28
-
29
-
30
-
31
-
32
-
33
-
34
-
35
-
36
-
37
-
38
-
39
-
40
-
41
-
42
-
43
-
44
-
45
-
46
-
47
-
48
-
49
-
50
-
51
-
52
-
53
-
54
-
55
-
56
-
57
-
58
-
59
-
60
-
61
-
62
-
63
-
64
-
65
-
66
-
67
-
68
-
69
-
70
-
71
-
72
-
73
-
74
-
75
-
76
-
77
-
78
-
79
-
80
-
81
-
82
-
83
-
84
-
85
-
86
-
87
-
88
-
89
-
90
-
91
-
92
 |
 |

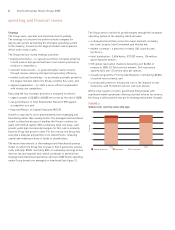
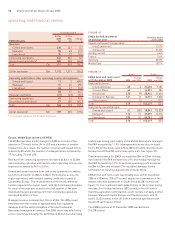
Group revenue for the 12 months ended 31 December 2005 was
£1,910m, compared with £2,204m for the 12 months ended
31 December 2004.
Discontinued operations represents the results from operations that
have been sold or are held for sale and where there is a co-ordinated
plan of disposal. In this OFR, discontinued operations includes
Soft Drinks, the UK, US and Australasian hotels sold since
1 January 2004, and the portfolio of 24 predominantly midscale
European hotels. Discontinued revenue totalled £1,058m in 2005.
Revenue from continuing operations for the 12 months to
31 December 2005 was £852m, 17% up on 2004. Total operating
profit before other operating income and expenses was £339m
in the 12 months to 31 December 2005, compared with £346m
in 2004. For continuing operations, operating profit before other
operating income and expenses was 42% up on 2004 at £190m.
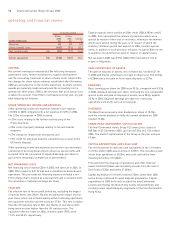
Profit before tax was £284m in the 12 months to 31 December 2005
against £264m in the previous year; for continuing operations, profit
before tax was £144m compared with £52m in 2004.
Basic earnings per share were 95.2p compared with 53.9p in the
12 months to 31 December 2004. Adjusted earnings per share,
excluding special items and the gain on disposal of assets to give
a more meaningful comparison of ongoing performance, was 38.2p
in 2005, up 13% on 2004. For continuing operations, adjusted
earnings per share was 24.9p, 44% up on 2004.
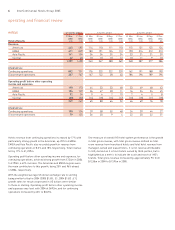
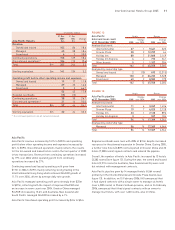
SOFT DRINKS
The Group results include the results of Soft Drinks for the period
up until the IPO of Britvic plc on 14 December 2005.
The disposal of Soft Drinks led to the Group receiving proceeds
of approximately £371m (including additional dividends) and
removed £341m of previously consolidated Soft Drinks debt
from the balance sheet.
Periods ended
14 Dec 31 Dec
2005 2004
Soft Drinks £m £m
Revenue 671 706
Operating profit before other operating
income and expenses 70 77
InterContinental Hotels Group 2005 5
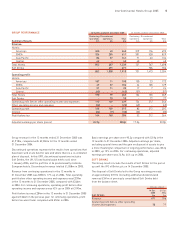
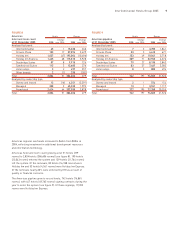
GROUP PERFORMANCE 12 months ended 31 December 2005 12 months ended 31 December 2004
Continuing Discontinued Continuing Discontinued
operations operations Total operations operations Total
Summary Results £m £m £m £m £m £m
Revenue:
Hotels:
Americas 400 45 445 319 176 495
EMEA 326 285 611 301 528 829
Asia Pacific 84 57 141 71 63 134
Central 42 – 42 40 – 40
Total Hotels 852 387 1,239 731 767 1,498
Soft Drinks – 671 671 – 706 706
852 1,058 1,910 731 1,473 2,204
Operating profit:
Hotels:
Americas 187 11 198 150 23 173
EMEA 47 57 104 24 105 129
Asia Pacific 21 11 32 17 7 24
Central (65) – (65) (57) – (57)
Total Hotels 190 79 269 134 135 269
Soft Drinks –7070 –7777
Operating profit before other operating income and expenses 190 149 339 134 212 346
Other operating income and expenses (22) – (22) (49) – (49)
Operating profit 168 149 317 85 212 297
Interest (24) (9) (33) (33) – (33)
Profit before tax 144 140 284 52 212 264
Adjusted earnings per share (pence) 24.9p 38.2p 17.3p 33.9p