Holiday Inn 2005 Annual Report Download - page 56
Download and view the complete annual report
Please find page 56 of the 2005 Holiday Inn annual report below. You can navigate through the pages in the report by either clicking on the pages listed below, or by using the keyword search tool below to find specific information within the annual report.-
 1
1 -
2
-
3
-
4
-
5
-
6
-
7
-
8
-
9
-
10
-
11
-
12
-
13
-
14
-
15
-
16
-
17
-
18
-
19
-
20
-
21
-
22
-
23
-
24
-
25
-
26
-
27
-
28
-
29
-
30
-
31
-
32
-
33
-
34
-
35
-
36
-
37
-
38
-
39
-
40
-
41
-
42
-
43
-
44
-
45
-
 46
46 -
 47
47 -
 48
48 -
 49
49 -
 50
50 -
 51
51 -
 52
52 -
 53
53 -
 54
54 -
 55
55 -
 56
56 -
 57
57 -
 58
58 -
 59
59 -
 60
60 -
 61
61 -
 62
62 -
 63
63 -
 64
64 -
 65
65 -
 66
66 -
67
-
68
-
69
-
70
-
71
-
72
-
73
-
74
-
75
-
76
-
77
-
78
-
79
-
80
-
81
-
82
-
83
-
84
-
85
-
86
-
87
-
88
-
89
-
90
-
91
-
92
 |
 |

2005 2004
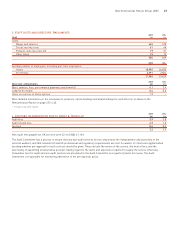
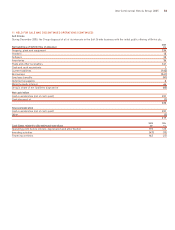
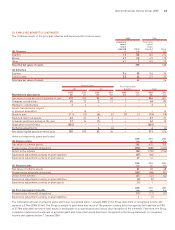
12 GOODWILL £m £m
At 1 January 152 158
Disposals (44) –
Exchange and other adjustments 10 (6)
At 31 December 118 152
Goodwill acquired through past business combinations has been allocated to cash-generating units (CGUs) for impairment testing as follows:
2005 2004
£m £m
Hotels
Americas managed and franchised operations (comprising several CGUs) 82 75
Asia Pacific managed and franchised operations 36 53
Soft Drinks –24
118 152
The recoverable amounts of the Hotels CGUs are determined from value in use calculations. The key assumptions for the value in use
calculations are those regarding discount rates and growth rates. Management estimates discount rates using pre-tax rates that reflect
current market assessments of the time value of money and the risks specific to the CGUs. Growth rates are based on both management
development plans and industry growth forecasts.
Americas managed and franchised operations
The Group prepares cash flow forecasts derived from the most recent financial budgets approved by management for the next year and
extrapolates cash flows for the following four years based on an estimated growth rate of 4% (2004 5%). After this period, the terminal
value of future cash flows is calculated based on a perpetual growth rate of approximately 2% (2004 2%). The rate used to discount the
forecast cash flow ranges from 10.0% to 10.5% (2004 10.0% to 10.5%).
Asia Pacific managed and franchised operations
The Group prepares cash flow forecasts derived from the most recent financial budgets approved by management for the next year and
extrapolates cash flows for the following four years based on an estimated growth rate of 4% (2004 7%). After this period, the terminal
value of future cash flows is calculated based on a perpetual growth rate of approximately 4% (2004 4%). The rate used to discount the
forecast cash flows is 11.0% (2004 11.0%).
The reduction in growth rates from 2004 is a result of the completion of several sale and manage back transactions in 2005 which had
previously been included in forecast growth rates.
notes to the financial statements
54 InterContinental Hotels Group 2005