Holiday Inn 2005 Annual Report Download - page 48
Download and view the complete annual report
Please find page 48 of the 2005 Holiday Inn annual report below. You can navigate through the pages in the report by either clicking on the pages listed below, or by using the keyword search tool below to find specific information within the annual report.-
 1
1 -
2
-
3
-
4
-
5
-
6
-
7
-
8
-
9
-
10
-
11
-
12
-
13
-
14
-
15
-
16
-
17
-
18
-
19
-
20
-
21
-
22
-
23
-
24
-
25
-
26
-
27
-
28
-
29
-
30
-
31
-
32
-
33
-
34
-
35
-
36
-
37
-
 38
38 -
 39
39 -
 40
40 -
 41
41 -
 42
42 -
 43
43 -
 44
44 -
 45
45 -
 46
46 -
 47
47 -
 48
48 -
 49
49 -
 50
50 -
 51
51 -
 52
52 -
 53
53 -
 54
54 -
 55
55 -
 56
56 -
 57
57 -
 58
58 -
59
-
60
-
61
-
62
-
63
-
64
-
65
-
66
-
67
-
68
-
69
-
70
-
71
-
72
-
73
-
74
-
75
-
76
-
77
-
78
-
79
-
80
-
81
-
82
-
83
-
84
-
85
-
86
-
87
-
88
-
89
-
90
-
91
-
92
 |
 |

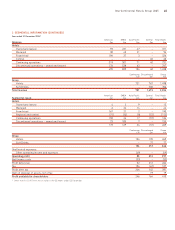
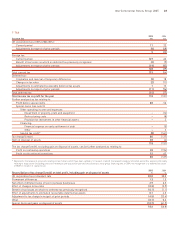
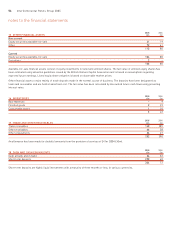
2 SEGMENTAL INFORMATION (CONTINUED)
Year ended 31 December 2004*
Americas EMEA Asia Pacific Central Total Hotels Soft Drinks Total Group
Assets and liabilities £m £m £m £m £m £m £m
Segment assets 583 1,202 437 86 2,308 458 2,766
Non-current assets classified as held for sale 424 1,402 – – 1,826 – 1,826
1,007 2,604 437 86 4,134 458 4,592
Unallocated assets:
Current tax receivable 14 – 14
Cash and cash equivalents 60 12 72
Total assets 4,208 470 4,678
Segment liabilities 300 290 28 – 618 291 909
Liabilities classified as held for sale 24 124 – – 148 – 148
324 414 28 – 766 291 1,057
Unallocated liabilities:
Current tax payable 248 13 261
Deferred tax payable 246 (12) 234
Loans and other borrowings 1,185 3 1,188
Total liabilities 2,445 295 2,740
Americas EMEA Asia Pacific Central Total Hotels Soft Drinks Total Group
Other segment information £m £m £m £m £m £m £m
Continuing operations:
Capital expenditure 45 37 15 12 109 – 109
Depreciation and amortisationa12 26 6 15 59 – 59
Impairment of property, plant and equipment 14 30 4 – 48 – 48
Discontinued operations:
Capital expenditure 15 58 5 – 78 70 148
Depreciation and amortisationa17 44 7 – 68 46 114
* Other than for Soft Drinks which reflects the 53 weeks ended 25 December.
a Included in the £173m of depreciation and amortisation is £23m that relates to administrative expenses.
notes to the financial statements
46 InterContinental Hotels Group 2005