Holiday Inn 2005 Annual Report Download - page 65
Download and view the complete annual report
Please find page 65 of the 2005 Holiday Inn annual report below. You can navigate through the pages in the report by either clicking on the pages listed below, or by using the keyword search tool below to find specific information within the annual report.-
 1
1 -
2
-
3
-
4
-
5
-
6
-
7
-
8
-
9
-
10
-
11
-
12
-
13
-
14
-
15
-
16
-
17
-
18
-
19
-
20
-
21
-
22
-
23
-
24
-
25
-
26
-
27
-
28
-
29
-
30
-
31
-
32
-
33
-
34
-
35
-
36
-
37
-
38
-
39
-
40
-
41
-
42
-
43
-
44
-
45
-
46
-
47
-
48
-
49
-
50
-
51
-
52
-
53
-
54
-
 55
55 -
 56
56 -
 57
57 -
 58
58 -
 59
59 -
 60
60 -
 61
61 -
 62
62 -
 63
63 -
 64
64 -
 65
65 -
 66
66 -
 67
67 -
 68
68 -
 69
69 -
 70
70 -
 71
71 -
 72
72 -
 73
73 -
 74
74 -
 75
75 -
76
-
77
-
78
-
79
-
80
-
81
-
82
-
83
-
84
-
85
-
86
-
87
-
88
-
89
-
90
-
91
-
92
 |
 |

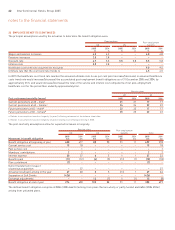
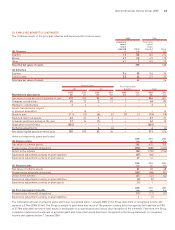
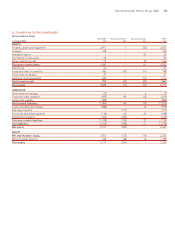
23 EMPLOYEE BENEFITS (CONTINUED)
The combined assets of the principal schemes and expected rate of return were:
2005 2004
Long-term Long-term
rate of rate of
return return
expected Value expected Value
UK Schemes %£m %£m
Equities 7.5 138 8.0 272
Bonds 4.7 110 4.9 173
Other 4.1 2 8.0 25
Total market value of assets 250 470
US Schemes
Equities 9.6 38 9.6 34
Fixed income 5.5 24 5.5 22
Total market value of assets 62 56
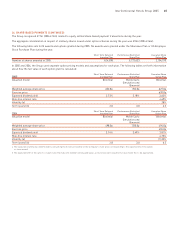
Pension plans Post-employment
UK US benefits Total
2005 2004 2005 2004 2005 2004 2005 2004
Movement in plan assets £m £m £m £m £m £m £m £m
Fair value of plan assets at beginning of year 470 353 56 48 ––526 401
Company contributions 45 72 212 1148 85
Members’ contributions 22––––22
Assets transferred in respect
of previous acquisition –14 –––––14
Benefits paid (11) (12) (6) (5) (1) (1) (18) (18)
Expected return on assets 32 27 54––37 31
Actuarial gain/(loss) arising in the year 47 14 (1) 1––46 15
Separation of Soft Drinks (335) –––––(335) –
Exchange adjustments ––6(4) ––6(4)
Fair value of plan assets at end of year 250 470 62 56 ––312 526
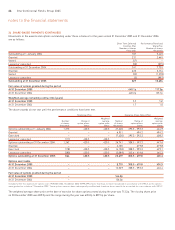
History of experience gains and losses:
2005 2004 2003
UK Pension plans £m £m £m
Fair value of scheme assets 250 470 353
Present value of benefit obligations (274) (600) (477)
Deficit in the scheme (24) (130) (124)
Experience adjustments arising on plan liabilities (67) (60)
Experience adjustments arising on plan assets 47 14
2005 2004 2003
US Pension plans £m £m £m
Fair value of scheme assets 62 56 48
Present value of benefit obligations (103) (88) (91)
Deficit in the scheme (41) (32) (43)
Experience adjustments arising on plan liabilities (3) (5)
Experience adjustments arising on plan assets (1) 1
2005 2004 2003
US Post-employment benefits £m £m £m
Present value of benefit obligations (11) (11) (11)
Experience adjustments arising on plan liabilities 1(1)
The cumulative amount of actuarial gains and losses recognised since 1 January 2004 in the Group statement of recognised income and
expense is £74m (2004 £51m). The Group is unable to determine how much of the pension scheme deficit recognised on transition to IFRS
of £178m and taken directly to total equity is attributable to actuarial gains and losses since inception of the schemes. Therefore, the Group
is unable to determine the amount of actuarial gains and losses that would have been recognised in the Group statement of recognised
income and expense before 1 January 2004.
InterContinental Hotels Group 2005 63