Holiday Inn 2005 Annual Report Download - page 9
Download and view the complete annual report
Please find page 9 of the 2005 Holiday Inn annual report below. You can navigate through the pages in the report by either clicking on the pages listed below, or by using the keyword search tool below to find specific information within the annual report.-
 1
1 -
 2
2 -
 3
3 -
 4
4 -
 5
5 -
 6
6 -
 7
7 -
 8
8 -
 9
9 -
 10
10 -
 11
11 -
 12
12 -
 13
13 -
 14
14 -
 15
15 -
 16
16 -
 17
17 -
 18
18 -
 19
19 -
 20
20 -
21
-
22
-
23
-
24
-
25
-
26
-
27
-
28
-
29
-
30
-
31
-
32
-
33
-
34
-
35
-
36
-
37
-
38
-
39
-
40
-
41
-
42
-
43
-
44
-
45
-
46
-
47
-
48
-
49
-
50
-
51
-
52
-
53
-
54
-
55
-
56
-
57
-
58
-
59
-
60
-
61
-
62
-
63
-
64
-
65
-
66
-
67
-
68
-
69
-
70
-
71
-
72
-
73
-
74
-
75
-
76
-
77
-
78
-
79
-
80
-
81
-
82
-
83
-
84
-
85
-
86
-
87
-
88
-
89
-
90
-
91
-
92
 |
 |

InterContinental Hotels Group 2005 7
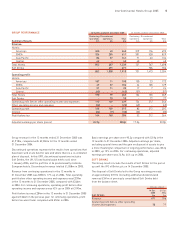
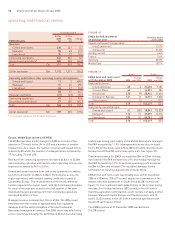
Room Count and Pipeline
The IHG global system (that is, the number of hotels/rooms owned,
leased, managed or franchised by the Group) grew significantly during
2005 ending the year at 3,606 hotels and 537,533 rooms, 66 hotels and
3,331 rooms higher than at 31 December 2004 (see figure 5). During
the year, 254 hotels with 34,880 rooms joined the system, while
188 hotels with 31,549 rooms left the system. Of the hotels leaving
the system 139 (21,764 rooms) were in the Americas and 46 (7,896
rooms) were in EMEA. The EMEA removals included 6,338 rooms
from the termination of franchise agreements in South Africa.
Excluding the South African franchise removals and eight hotels
(2,135 rooms) exiting the system due to hurricane damage, net
system size increased by 101 hotels (11,804 rooms).
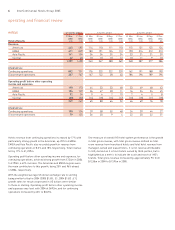
One of the key elements of the asset disposal programme is the
retention of management contracts for the hotels sold. Of those
sold since April 2003, management contracts or franchise
agreements were retained on 126 hotels. Overall, the number of
owned and leased rooms fell by 22,935 while the number of
managed and franchised rooms in the system grew by 22,296
rooms and 3,970 rooms respectively.
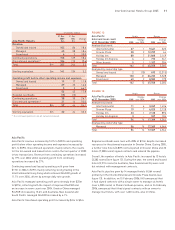
At the end of 2005, the number of rooms in the pipeline (that is,
contracts signed but hotels/rooms yet to enter the system) was
108,512 – 31% up on 31 December 2004 and the highest ever for the
Group (see figure 6). This positions the Group well to achieve its stated
goal of organic growth of 50,000 to 60,000 net rooms in the period
June 2005 to December 2008. Whilst there is no guarantee that all
of the pipeline will enter the system in that period, a number of
initiatives are in place to both secure new deals and to reduce the
time between a hotel signing with IHG and opening.
The growth in pipeline was fuelled by record signings during 2005;
69,970 rooms were signed which was over 60% up on the average
for the last five years. This partly reflects the increased investment
in development resource particularly in the Americas and Asia Pacific.
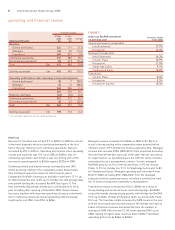
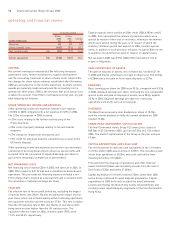
Reservation Systems and Loyalty Programme
IHG supports revenue delivery into its hotels through its global
reservation systems and global loyalty programme, Priority Club
Rewards. In 2005, global system room revenue booked through
IHG’s reservation channels rose by approximately 19% to $4.8bn,
and the proportion of IHG global system room revenue booked via
IHG’s reservation channels increased from 38% to 41%.
The internet channel continued to show strong growth, with global
system room revenue booked via the internet increasing by 23% to
$1.7bn, accounting for approximately 14% of IHG global system
room revenue (up from 13% in 2004).
Room revenue generated from Priority Club Rewards members
was $3.8bn and represented approximately 32% of IHG global
system room revenue.
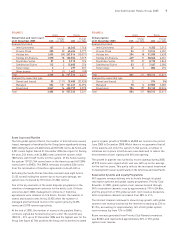
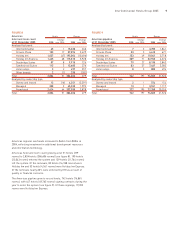
FIGURE 5
Hotels Rooms
Global hotel and room count Change Change
at 31 December 2005 2005 over 2004 2005 over 2004
Analysed by brand:
InterContinental 137 546,262 1,746
Crowne Plaza 235 20 65,404 3,777
Holiday Inn 1,435 (49) 267,816 (10,971)
Holiday Inn Express 1,590 78 133,554 7,519
Staybridge Suites 87 89,915 726
Candlewood Suites 112 312,683 276
Hotel indigo 32497 357
Other brands 7(1) 1,402 (99)
Total 3,606 66 537,533 3,331
Analysed by ownership type:
Owned and leased 55 (111) 15,485 (22,935)
Managed 504 101 121,249 22,296
Franchised 3,047 76 400,799 3,970
Total 3,606 66 537,533 3,331
FIGURE 6
Hotels Rooms
Global pipeline Change Change
at 31 December 2005 2005 over 2004 2005 over 2004
Analysed by brand:
InterContinental 27 69,353 2,513
Crowne Plaza 54 17 13,514 4,201
Holiday Inn 204 48 31,035 5,630
Holiday Inn Express 429 71 38,066 6,351
Staybridge Suites 79 27 8,195 2,843
Candlewood Suites 83 37 7,467 3,583
Hotel indigo 85882 494
Total 884 211 108,512 25,615
Analysed by ownership type:
Owned and leased 2–574 (96)
Managed 98 14 27,805 5,387
Franchised 784 197 80,133 20,324
Total 884 211 108,512 25,615