Holiday Inn 2005 Annual Report Download - page 2
Download and view the complete annual report
Please find page 2 of the 2005 Holiday Inn annual report below. You can navigate through the pages in the report by either clicking on the pages listed below, or by using the keyword search tool below to find specific information within the annual report.-
 1
1 -
 2
2 -
 3
3 -
 4
4 -
 5
5 -
 6
6 -
 7
7 -
 8
8 -
 9
9 -
 10
10 -
 11
11 -
 12
12 -
 13
13 -
14
-
15
-
16
-
17
-
18
-
19
-
20
-
21
-
22
-
23
-
24
-
25
-
26
-
27
-
28
-
29
-
30
-
31
-
32
-
33
-
34
-
35
-
36
-
37
-
38
-
39
-
40
-
41
-
42
-
43
-
44
-
45
-
46
-
47
-
48
-
49
-
50
-
51
-
52
-
53
-
54
-
55
-
56
-
57
-
58
-
59
-
60
-
61
-
62
-
63
-
64
-
65
-
66
-
67
-
68
-
69
-
70
-
71
-
72
-
73
-
74
-
75
-
76
-
77
-
78
-
79
-
80
-
81
-
82
-
83
-
84
-
85
-
86
-
87
-
88
-
89
-
90
-
91
-
92
 |
 |

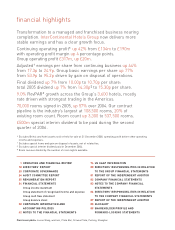
financial highlights
Transformation to a managed and franchised business nearing
completion. InterContinental Hotels Group now delivers more
stable earnings and has a clear growth focus.
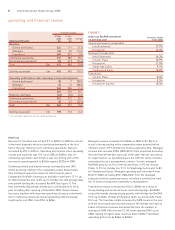
Continuing operating profit* up 42% from £134m to £190m
with operating profit margin up 4 percentage points.
Group operating profit £317m, up £20m.
Adjusted†earnings per share from continuing business up 44%
from 17.3p to 24.9p. Group basic earnings per share up 77%
from 53.9p to 95.2p driven by gain on disposal of operations.
Final dividend up 7% from 10.00p to 10.70p per share:
total 2005 dividend up 7% from 14.30p§to 15.30p per share.
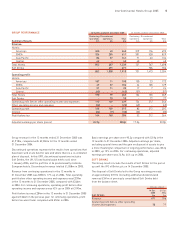
9.0% RevPAR#growth across the Group’s 3,600 hotels, mostly
rate driven with strongest trading in the Americas.
70,000 rooms signed in 2005, up 57% over 2004. Our contract
pipeline is the industry’s largest at 108,500 rooms, 20% of
existing room count. Room count up 3,300 to 537,500 rooms.
£500m special interim dividend to be paid during the second
quarter of 2006.
* Excludes Britvic and hotel assets sold or held for sale at 31 December 2005; operating profit before other operating
income and expenses.
†Excludes special items and gain on disposal of assets, net of related tax.
§Excludes special interim dividend paid in December 2004.
#Room revenue divided by the number of room nights available.
1OPERATING AND FINANCIAL REVIEW
18 DIRECTORS’ REPORT
20 CORPORATE GOVERNANCE
24 AUDIT COMMITTEE REPORT
25 REMUNERATION REPORT
34 FINANCIAL STATEMENTS
Group income statement
Group statement of recognised income and expense
Group cash flow statement
Group balance sheet
38 CORPORATE INFORMATION AND
ACCOUNTING POLICIES
42 NOTES TO THE FINANCIAL STATEMENTS
76 US GAAP INFORMATION
80 DIRECTORS’ RESPONSIBILITIES IN RELATION
TO THE GROUP FINANCIAL STATEMENTS
81 REPORT OF THE INDEPENDENT AUDITOR
82 COMPANY FINANCIAL STATEMENTS
83 NOTES TO THE COMPANY FINANCIAL
STATEMENTS
86 DIRECTORS’ RESPONSIBILITIES IN RELATION
TO THE COMPANY FINANCIAL STATEMENTS
87 REPORT OF THE INDEPENDENT AUDITOR
88 GLOSSARY
89 SHAREHOLDER PROFILE AND
FORWARD-LOOKING STATEMENTS
Front cover photo: Louise Wang, waitress, Plaza Bar, Crowne Plaza, Pudong, Shanghai